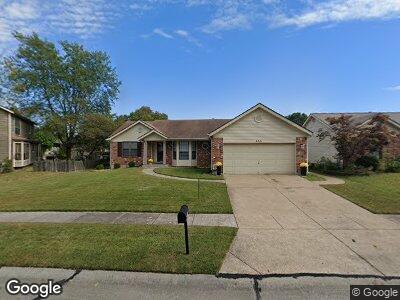
635 Bugle Run Dr Florissant, MO 63034
Estimated Value: $225,000 - $260,000
3
Beds
2
Baths
1,629
Sq Ft
$147/Sq Ft
Est. Value
About This Home
This home is located at 635 Bugle Run Dr, Florissant, MO 63034 and is currently estimated at $239,513, approximately $147 per square foot. 635 Bugle Run Dr is a home located in St. Louis County with nearby schools including Barrington Elementary School, North Middle School, and Hazelwood Central High School.
Ownership History
Date
Name
Owned For
Owner Type
Purchase Details
Closed on
Mar 8, 2022
Sold by
Shenghui Duan
Bought by
Fc & S Investments Llc
Current Estimated Value
Purchase Details
Closed on
May 12, 2015
Sold by
Federal Home Loan Mortgage Corporation
Bought by
Duan Shenghu
Purchase Details
Closed on
Dec 23, 2014
Sold by
Williams Stacey
Bought by
Ocwen Loan Servicing Llc
Purchase Details
Closed on
Jan 22, 2013
Sold by
Ocwen Loan Servicing Llc
Bought by
Federal Home Loan Mortgage Corporation
Purchase Details
Closed on
Jan 5, 2007
Sold by
Donley James E
Bought by
Deutsche Bank National Trust Co
Purchase Details
Closed on
Dec 17, 2004
Sold by
Mrozowicz Eugene F
Bought by
Dixon Geraldine D
Home Financials for this Owner
Home Financials are based on the most recent Mortgage that was taken out on this home.
Original Mortgage
$152,000
Interest Rate
7.12%
Mortgage Type
Purchase Money Mortgage
Create a Home Valuation Report for This Property
The Home Valuation Report is an in-depth analysis detailing your home's value as well as a comparison with similar homes in the area
Home Values in the Area
Average Home Value in this Area
Purchase History
| Date | Buyer | Sale Price | Title Company |
|---|---|---|---|
| Fc & S Investments Llc | -- | None Listed On Document | |
| Duan Shenghu | $57,750 | Security Title Ins Agency Cm | |
| Ocwen Loan Servicing Llc | $74,728 | None Available | |
| Federal Home Loan Mortgage Corporation | -- | None Available | |
| Deutsche Bank National Trust Co | $160,000 | None Available | |
| Dixon Geraldine D | $160,000 | -- |
Source: Public Records
Mortgage History
| Date | Status | Borrower | Loan Amount |
|---|---|---|---|
| Previous Owner | Duan Shenghui | $105,000 | |
| Previous Owner | Williams | $104,000 | |
| Previous Owner | Dixon Geraldine D | $152,000 |
Source: Public Records
Tax History Compared to Growth
Tax History
| Year | Tax Paid | Tax Assessment Tax Assessment Total Assessment is a certain percentage of the fair market value that is determined by local assessors to be the total taxable value of land and additions on the property. | Land | Improvement |
|---|---|---|---|---|
| 2023 | $3,359 | $37,070 | $4,010 | $33,060 |
| 2022 | $3,194 | $31,350 | $6,140 | $25,210 |
| 2021 | $3,023 | $31,350 | $6,140 | $25,210 |
| 2020 | $2,673 | $25,790 | $4,620 | $21,170 |
| 2019 | $2,630 | $25,790 | $4,620 | $21,170 |
| 2018 | $2,686 | $24,360 | $3,170 | $21,190 |
| 2017 | $2,683 | $24,360 | $3,170 | $21,190 |
| 2016 | $2,560 | $22,850 | $3,170 | $19,680 |
| 2015 | $2,501 | $22,850 | $3,170 | $19,680 |
| 2014 | -- | $22,970 | $3,930 | $19,040 |
Source: Public Records
Map
Nearby Homes
- 623 Bugle Run Dr
- 3814 Triple Crown Dr
- 4021 96th Ave
- 15692 Karsten Dr
- 3903 Triple Crown Dr
- 3968 Triple Crown Dr
- 4242 Vaile Ave
- 972 Brookfield Chase Ct
- 926 Justice Ct
- 969 Brookfield Chase Ct
- 1056 Saratoga Springs Ct
- 4309 Bangor Dr
- 3818 Kentucky Derby Dr
- 1061 Patience Dr
- 4260 Cherry Wood Trail Dr
- 3524 Espace Ct
- 1184 English Saddle Rd
- 16439 Hampden Place
- 14706 Airelle Ct
- 1323 Woodpath Dr
- 635 Bugle Run Dr
- 631 Bugle Run Dr
- 4155 Bugle Bend Dr
- 4149 Bugle Bend Dr
- 4137 Bugle Bend Dr
- 4133 Bugle Bend Dr
- 627 Bugle Run Dr
- 636 Bugle Run Dr
- 632 Bugle Run Dr
- 4129 Bugle Bend Dr
- 640 Bugle Run Dr
- 628 Bugle Run Dr
- 625 623 Buglerun
- 4125 Bugle Bend Dr
- 4154 Bugle Bend Dr
- 4150 Bugle Bend Dr
- 624 Bugle Run Dr
- 4162 Bugle Bend Dr
- 4158 Bugle Bend Dr
- 4146 Fox Crossing Dr