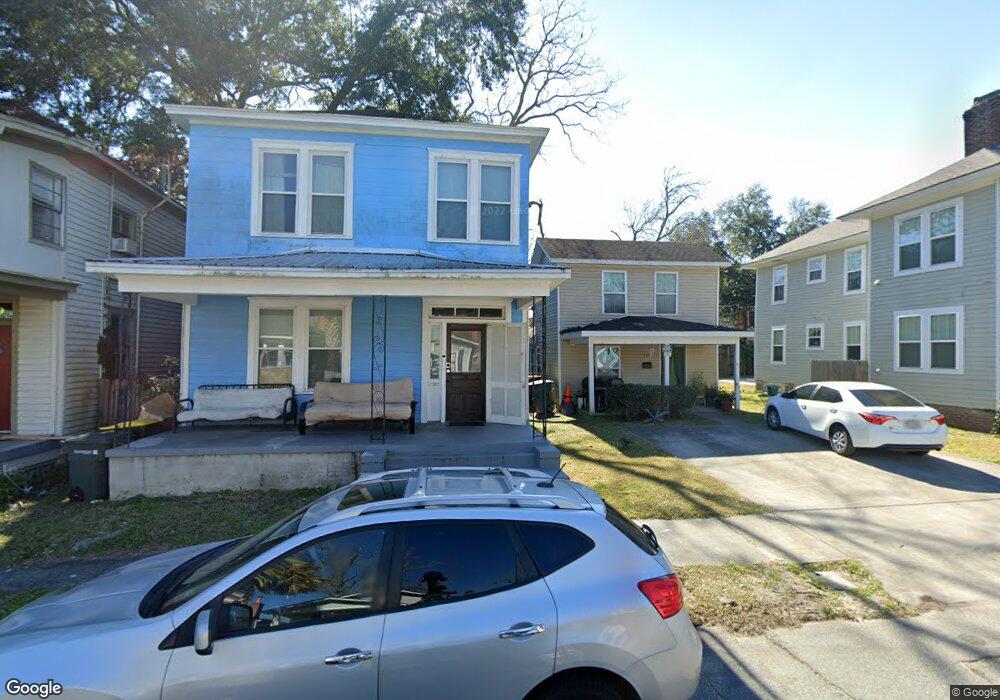
635 E 39th St Savannah, GA 31401
Midtown Savannah NeighborhoodEstimated Value: $198,000 - $349,000
3
Beds
2
Baths
1,136
Sq Ft
$254/Sq Ft
Est. Value
About This Home
This home is located at 635 E 39th St, Savannah, GA 31401 and is currently estimated at $288,661, approximately $254 per square foot. 635 E 39th St is a home located in Chatham County with nearby schools including Shuman Elementary School, Hubert Middle School, and Savannah Arts Academy.
Ownership History
Date
Name
Owned For
Owner Type
Purchase Details
Closed on
May 12, 2021
Sold by
Gbu Construction Llc
Bought by
Gbu Management Llc
Current Estimated Value
Purchase Details
Closed on
Mar 9, 2012
Purchase Details
Closed on
Aug 17, 2009
Sold by
Jameson Jerald W
Bought by
Barklow Inc
Purchase Details
Closed on
Aug 10, 2009
Sold by
Barklow Inc
Bought by
Jameson Jerald W
Purchase Details
Closed on
Jul 31, 2009
Sold by
Purvis Jordan J
Bought by
Barklow Inc
Purchase Details
Closed on
Jul 24, 2009
Sold by
Jameson Jerald W
Bought by
Barklow Inc
Purchase Details
Closed on
Jul 7, 2009
Sold by
Chatham County Tax Commiss
Bought by
Barklow Inc
Create a Home Valuation Report for This Property
The Home Valuation Report is an in-depth analysis detailing your home's value as well as a comparison with similar homes in the area
Home Values in the Area
Average Home Value in this Area
Purchase History
| Date | Buyer | Sale Price | Title Company |
|---|---|---|---|
| Gbu Management Llc | -- | -- | |
| -- | $5,000 | -- | |
| Gbu Construction Llc | $5,000 | -- | |
| Barklow Inc | -- | -- | |
| Jameson Jerald W | -- | -- | |
| Barklow Inc | -- | -- | |
| Barklow Inc | -- | -- | |
| Barklow Inc | -- | -- |
Source: Public Records
Tax History
| Year | Tax Paid | Tax Assessment Tax Assessment Total Assessment is a certain percentage of the fair market value that is determined by local assessors to be the total taxable value of land and additions on the property. | Land | Improvement |
|---|---|---|---|---|
| 2025 | $2,936 | $59,440 | $20,000 | $39,440 |
| 2024 | $23 | $59,440 | $20,000 | $39,440 |
| 2023 | $616 | $59,440 | $20,000 | $39,440 |
| 2022 | $1,369 | $79,560 | $20,000 | $59,560 |
| 2021 | $2,619 | $44,400 | $8,000 | $36,400 |
| 2020 | $1,402 | $44,400 | $8,000 | $36,400 |
| 2019 | $2,355 | $44,400 | $8,000 | $36,400 |
| 2018 | $2,516 | $42,960 | $8,000 | $34,960 |
| 2017 | $1,568 | $39,760 | $4,560 | $35,200 |
| 2016 | $1,146 | $39,280 | $4,560 | $34,720 |
| 2015 | $907 | $16,160 | $3,440 | $12,720 |
| 2014 | $896 | $16,160 | $0 | $0 |
Source: Public Records
Map
Nearby Homes
Your Personal Tour Guide
Ask me questions while you tour the home.