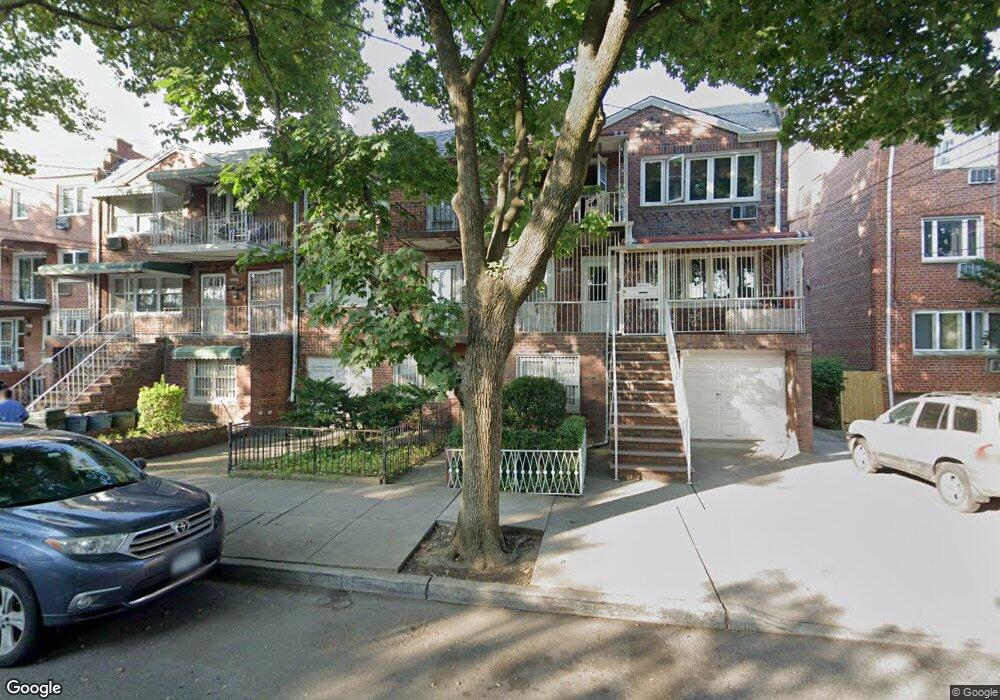
635 E 79th St Brooklyn, NY 11236
Canarsie NeighborhoodEstimated Value: $1,076,000 - $1,240,000
Studio
--
Bath
3,601
Sq Ft
$323/Sq Ft
Est. Value
About This Home
This home is located at 635 E 79th St, Brooklyn, NY 11236 and is currently estimated at $1,162,000, approximately $322 per square foot. 635 E 79th St is a home located in Kings County with nearby schools including P.S. 276 Louis Marshall, Is 68 Isaac Bildersee, and Explore Excel Charter School.
Ownership History
Date
Name
Owned For
Owner Type
Purchase Details
Closed on
May 10, 2001
Sold by
Layne Theresa A
Bought by
Layne Ramona
Current Estimated Value
Purchase Details
Closed on
Dec 14, 1999
Sold by
Duckworth Winston
Bought by
Layne Ramona and Layne Theresa A
Home Financials for this Owner
Home Financials are based on the most recent Mortgage that was taken out on this home.
Original Mortgage
$272,000
Interest Rate
7.91%
Create a Home Valuation Report for This Property
The Home Valuation Report is an in-depth analysis detailing your home's value as well as a comparison with similar homes in the area
Home Values in the Area
Average Home Value in this Area
Purchase History
| Date | Buyer | Sale Price | Title Company |
|---|---|---|---|
| Layne Ramona | -- | -- | |
| Layne Ramona | $352,000 | Old Republic Natl Title Ins |
Source: Public Records
Mortgage History
| Date | Status | Borrower | Loan Amount |
|---|---|---|---|
| Previous Owner | Layne Ramona | $272,000 |
Source: Public Records
Tax History
| Year | Tax Paid | Tax Assessment Tax Assessment Total Assessment is a certain percentage of the fair market value that is determined by local assessors to be the total taxable value of land and additions on the property. | Land | Improvement |
|---|---|---|---|---|
| 2025 | $10,449 | $76,200 | $17,100 | $59,100 |
| 2024 | $10,449 | $76,560 | $17,100 | $59,460 |
| 2023 | $10,411 | $72,600 | $17,100 | $55,500 |
| 2022 | $9,631 | $71,460 | $17,100 | $54,360 |
| 2021 | $9,568 | $64,560 | $17,100 | $47,460 |
| 2019 | $9,020 | $44,520 | $17,100 | $27,420 |
| 2018 | $8,649 | $43,887 | $16,329 | $27,558 |
| 2017 | $8,140 | $41,403 | $16,833 | $24,570 |
| 2016 | $7,499 | $39,060 | $17,100 | $21,960 |
| 2015 | $5,006 | $40,881 | $17,730 | $23,151 |
| 2014 | $5,006 | $38,568 | $14,214 | $24,354 |
Source: Public Records
Map
Nearby Homes
Your Personal Tour Guide
Ask me questions while you tour the home.