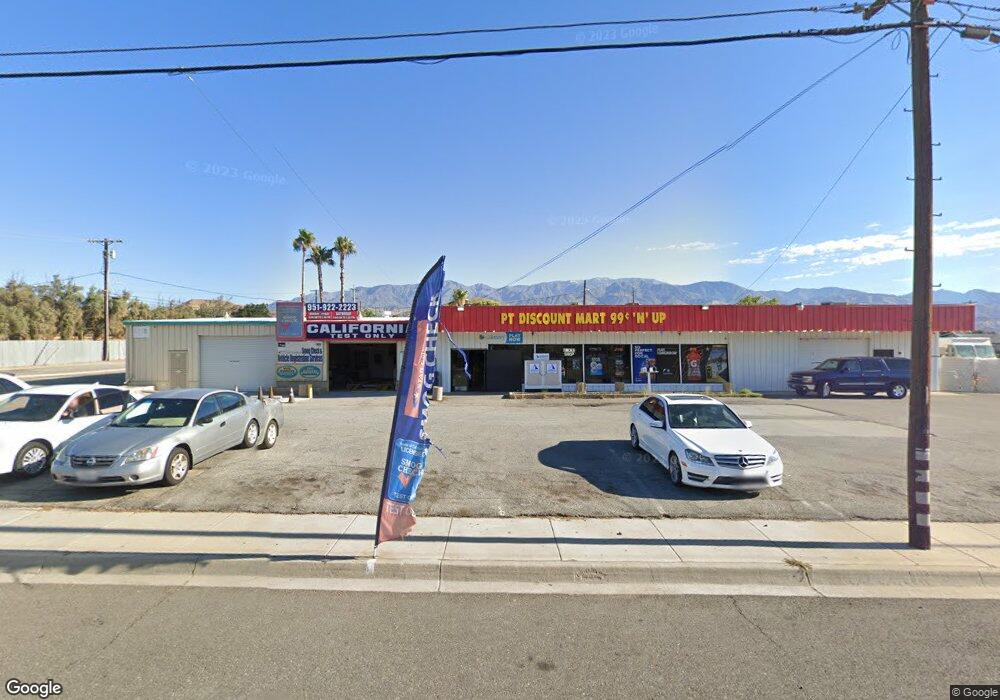
635 E Ramsey St Banning, CA 92220
Estimated Value: $602,495
Studio
--
Bath
9,000
Sq Ft
$67/Sq Ft
Est. Value
About This Home
This home is located at 635 E Ramsey St, Banning, CA 92220 and is currently estimated at $602,495, approximately $66 per square foot. 635 E Ramsey St is a home located in Riverside County with nearby schools including Banning High School.
Ownership History
Date
Name
Owned For
Owner Type
Purchase Details
Closed on
Aug 6, 2015
Sold by
Mattox Tod B
Bought by
Djrm Lim Family Trust
Current Estimated Value
Purchase Details
Closed on
Oct 3, 2012
Sold by
Pham Bingh Than and Nguyen Michael Qwang
Bought by
Mattox Stanley E and Mattox Marylou
Purchase Details
Closed on
Apr 28, 2005
Sold by
Mattox Stanley E and Mattox Marylou
Bought by
Pham Binh Thanh and Nguyen Michael Qwang
Home Financials for this Owner
Home Financials are based on the most recent Mortgage that was taken out on this home.
Original Mortgage
$203,356
Interest Rate
5.72%
Mortgage Type
Seller Take Back
Purchase Details
Closed on
Feb 4, 2003
Sold by
Mclean Neil E
Bought by
Mattox Stanley E and Mattox Marylou
Home Financials for this Owner
Home Financials are based on the most recent Mortgage that was taken out on this home.
Original Mortgage
$225,000
Interest Rate
5.79%
Mortgage Type
Commercial
Create a Home Valuation Report for This Property
The Home Valuation Report is an in-depth analysis detailing your home's value as well as a comparison with similar homes in the area
Home Values in the Area
Average Home Value in this Area
Purchase History
| Date | Buyer | Sale Price | Title Company |
|---|---|---|---|
| Djrm Lim Family Trust | $315,000 | Lawyers Title Ie | |
| Mattox Stanley E | $134,000 | Fidelity National Title Co | |
| Pham Binh Thanh | -- | Fidelity Natl Title Ins Co | |
| Mattox Stanley E | $300,000 | Fidelity Natl Title Ins Co |
Source: Public Records
Mortgage History
| Date | Status | Borrower | Loan Amount |
|---|---|---|---|
| Previous Owner | Pham Binh Thanh | $203,356 | |
| Previous Owner | Mattox Stanley E | $225,000 |
Source: Public Records
Tax History
| Year | Tax Paid | Tax Assessment Tax Assessment Total Assessment is a certain percentage of the fair market value that is determined by local assessors to be the total taxable value of land and additions on the property. | Land | Improvement |
|---|---|---|---|---|
| 2025 | $5,115 | $372,890 | $295,947 | $76,943 |
| 2023 | $5,115 | $358,412 | $284,456 | $73,956 |
| 2022 | $5,005 | $351,385 | $278,879 | $72,506 |
| 2021 | $4,909 | $344,496 | $273,411 | $71,085 |
| 2020 | $4,868 | $340,965 | $270,608 | $70,357 |
| 2019 | $4,793 | $334,280 | $265,302 | $68,978 |
| 2018 | $4,763 | $327,726 | $260,100 | $67,626 |
| 2017 | $4,687 | $321,300 | $255,000 | $66,300 |
| 2016 | $4,459 | $315,000 | $250,000 | $65,000 |
| 2015 | $5,423 | $384,226 | $240,782 | $143,444 |
| 2014 | $5,389 | $376,701 | $236,066 | $140,635 |
Source: Public Records
Map
Nearby Homes
- 433 E Livingston St
- 402 E Ramsey St
- 917 E Nicolet St Unit 157
- 296 N Alessandro St
- 1010 E Nicolet St
- 497 Martin St
- 495 Martin St
- 582 N Almond Way
- 0 Gorgonio Rd Unit SW25208341
- 0 Cabazon Unit CV26001873
- 0 Cabazon Unit CV25280859
- 292 E George St
- 333 N Murray St
- 957 E George St
- 1130 E George St
- 1396 Ramsey
- 1501 E Wilson St
- 0 Esperanza Firefighters Memorial Hwy
- 245 N Evans St
- 263 N Evans St
- 635 E Ramsey St Unit 4 units
- 685 E Ramsey St
- 4 S Livingston St
- 616 E Ramsey St
- 553 E Ramsey St
- 590 E Ramsey St Unit 300
- 590 E Ramsey St Unit 400
- 590 E Ramsey St
- 719 E Ramsey St Unit 6
- 719 E Ramsey St Unit 3
- 719 E Ramsey St
- 630 E Ramsey St
- 720 E Williams St
- 62 S Livingston St
- 775 E Ramsey St
- 520 W Williams St
- 59 S Alola St
- 520 E Williams St St
- 710 E Williams St
- 724 E Williams St
Your Personal Tour Guide
Ask me questions while you tour the home.