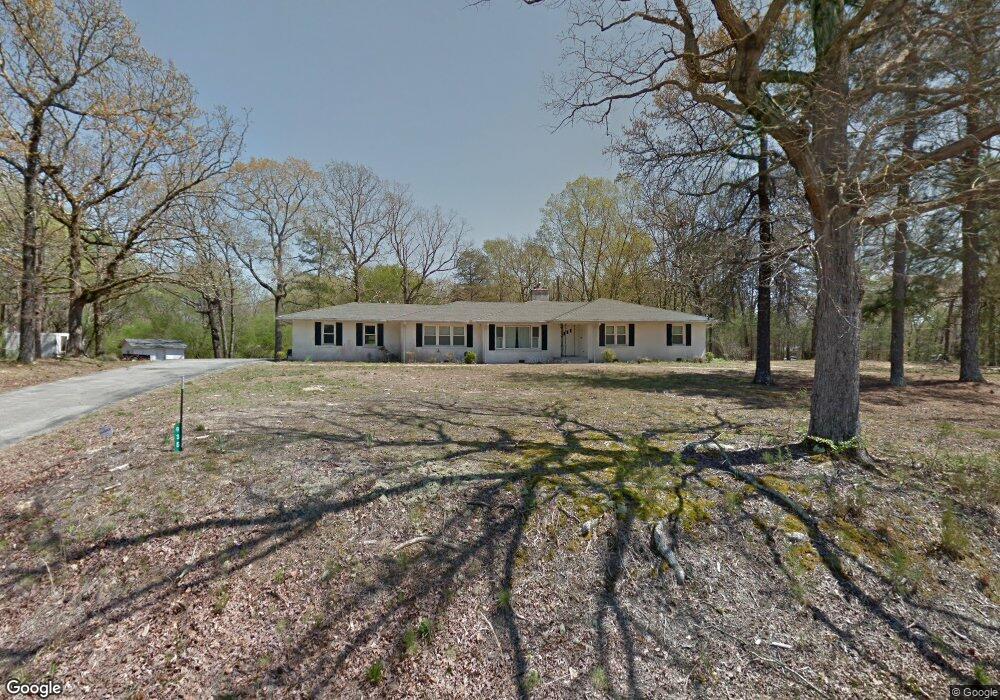
635 Fishermans Loop Savannah, TN 38372
Estimated Value: $214,000 - $277,000
--
Bed
3
Baths
2,501
Sq Ft
$98/Sq Ft
Est. Value
About This Home
This home is located at 635 Fishermans Loop, Savannah, TN 38372 and is currently estimated at $244,183, approximately $97 per square foot. 635 Fishermans Loop is a home located in Hardin County with nearby schools including Hardin County High School.
Ownership History
Date
Name
Owned For
Owner Type
Purchase Details
Closed on
Jan 1, 2017
Sold by
Welch Billy Joe
Bought by
Stroud Jimmy Noel
Current Estimated Value
Purchase Details
Closed on
Dec 2, 1974
Bought by
Gallaher Mildred
Purchase Details
Closed on
Aug 5, 1953
Create a Home Valuation Report for This Property
The Home Valuation Report is an in-depth analysis detailing your home's value as well as a comparison with similar homes in the area
Home Values in the Area
Average Home Value in this Area
Purchase History
| Date | Buyer | Sale Price | Title Company |
|---|---|---|---|
| Stroud Jimmy Noel | -- | -- | |
| Gallaher Mildred | -- | -- | |
| -- | -- | -- |
Source: Public Records
Tax History Compared to Growth
Tax History
| Year | Tax Paid | Tax Assessment Tax Assessment Total Assessment is a certain percentage of the fair market value that is determined by local assessors to be the total taxable value of land and additions on the property. | Land | Improvement |
|---|---|---|---|---|
| 2024 | $877 | $50,125 | $16,000 | $34,125 |
| 2023 | $877 | $50,125 | $16,000 | $34,125 |
| 2022 | $632 | $30,675 | $7,875 | $22,800 |
| 2021 | $632 | $30,675 | $7,875 | $22,800 |
| 2020 | $632 | $30,675 | $7,875 | $22,800 |
| 2019 | $632 | $30,675 | $7,875 | $22,800 |
| 2018 | $611 | $30,675 | $7,875 | $22,800 |
| 2017 | $560 | $26,925 | $7,875 | $19,050 |
| 2016 | $560 | $26,925 | $7,875 | $19,050 |
| 2015 | $490 | $26,925 | $7,875 | $19,050 |
| 2014 | $490 | $26,925 | $7,875 | $19,050 |
Source: Public Records
Map
Nearby Homes
- 175 Drake Loop
- 1031 Ridge Rd
- 61 Tulip Ln
- 1910 Hamburg Loop
- 225 Nixon Loop
- 470 Bandit Way
- LT 138 Bandit Way
- 3595 Northshore Dr
- 0 Northshore Dr Unit 24573680
- 3601 Northshore Dr
- 3600 Northshore Dr
- 0 Northshore Dr Unit 10186085
- 8 Captains Cove
- 5 & 6 Light Pointe
- 40 Baileys Way Pointe
- LOT 32 Tidewater Pnt
- LOT 7 Tidewater Pnt
- LOT 6 Tidewater Pnt
- 11 High Pointe Dr
- 21 High Pointe Dr
- 4115 Highway 128
- 4115 Tennessee 128
- 4000 Highway 128
- 535 Fishermans Loop
- 530 Fishermans Loop
- 65 Carpenter Ln
- 60 Hatley Loop
- 3960 Highway 128
- 3960 Highway 128
- 85 Hatley Loop
- 60 Carpenter Ln
- 0 Carpenter Ln Unit 3277443
- 0 Carpenter Ln Unit 9989603
- 135 Carpenter Ln
- 4265 Highway 128
- 130 Hatley Loop
- 170 Carpenter Ln
- 0 Cravens & Shelton Dr
- 0 Cravens Rd & Rosewood Dr
- 0 Cravens & Rosewood Dr