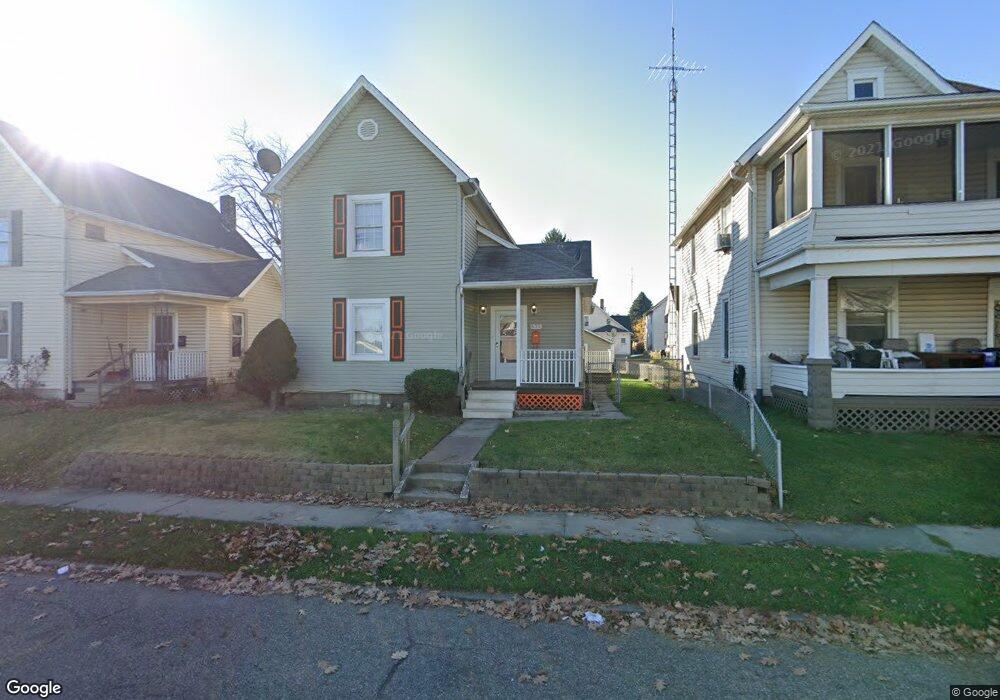
635 Greenfield Ave SW Canton, OH 44706
Southwest Canton NeighborhoodEstimated Value: $72,000 - $124,968
2
Beds
2
Baths
1,176
Sq Ft
$89/Sq Ft
Est. Value
About This Home
This home is located at 635 Greenfield Ave SW, Canton, OH 44706 and is currently estimated at $105,242, approximately $89 per square foot. 635 Greenfield Ave SW is a home located in Stark County with nearby schools including Early Learning Center @ Schreiber, Cedar Elementary School, and McGregor Elementary School.
Ownership History
Date
Name
Owned For
Owner Type
Purchase Details
Closed on
Oct 27, 2020
Sold by
Howard Diane L
Bought by
Sal Investment Properties Llc
Current Estimated Value
Purchase Details
Closed on
Sep 28, 2020
Sold by
Estate Of Brian C Howard
Bought by
Howard Diane L
Purchase Details
Closed on
Sep 17, 2001
Sold by
Gasper Christopher J and Gasper Kriste Curry
Bought by
Howard Brian and Howard Eric B
Home Financials for this Owner
Home Financials are based on the most recent Mortgage that was taken out on this home.
Original Mortgage
$72,000
Interest Rate
6.92%
Mortgage Type
Purchase Money Mortgage
Purchase Details
Closed on
Oct 14, 1994
Sold by
Walter Kenneth E
Bought by
Gasper Christopher J and Curry Kristen
Home Financials for this Owner
Home Financials are based on the most recent Mortgage that was taken out on this home.
Original Mortgage
$26,125
Interest Rate
8.55%
Mortgage Type
New Conventional
Create a Home Valuation Report for This Property
The Home Valuation Report is an in-depth analysis detailing your home's value as well as a comparison with similar homes in the area
Home Values in the Area
Average Home Value in this Area
Purchase History
| Date | Buyer | Sale Price | Title Company |
|---|---|---|---|
| Sal Investment Properties Llc | $25,000 | None Available | |
| Howard Diane L | -- | None Available | |
| Howard Brian | $76,000 | -- | |
| Gasper Christopher J | $30,900 | -- |
Source: Public Records
Mortgage History
| Date | Status | Borrower | Loan Amount |
|---|---|---|---|
| Previous Owner | Howard Brian | $72,000 | |
| Previous Owner | Gasper Christopher J | $26,125 |
Source: Public Records
Tax History Compared to Growth
Tax History
| Year | Tax Paid | Tax Assessment Tax Assessment Total Assessment is a certain percentage of the fair market value that is determined by local assessors to be the total taxable value of land and additions on the property. | Land | Improvement |
|---|---|---|---|---|
| 2025 | -- | $40,610 | $4,940 | $35,670 |
| 2024 | -- | $40,610 | $4,940 | $35,670 |
| 2023 | $750 | $12,290 | $2,380 | $9,910 |
| 2022 | $733 | $12,290 | $2,380 | $9,910 |
| 2021 | $740 | $12,290 | $2,380 | $9,910 |
| 2020 | $656 | $9,740 | $2,000 | $7,740 |
| 2019 | $575 | $9,740 | $2,000 | $7,740 |
| 2018 | $579 | $9,740 | $2,000 | $7,740 |
| 2017 | $608 | $9,320 | $2,070 | $7,250 |
| 2016 | $608 | $9,290 | $2,070 | $7,220 |
| 2015 | $612 | $9,290 | $2,070 | $7,220 |
| 2014 | $720 | $10,290 | $2,310 | $7,980 |
| 2013 | $348 | $10,290 | $2,310 | $7,980 |
Source: Public Records
Map
Nearby Homes
- 631 Greenfield Ave SW
- 633 Park Ave SW
- 906 Harrison Ave SW
- 2310 7th St SW
- 241 Raymont Ct SW
- 931 Smith Ave SW
- 719 Prospect Ave SW
- 2416 9th St SW
- 817 Prospect Ave SW
- 1009 Arlington Ave SW
- 201 Park Ave NW
- 921 Clarendon Ave SW
- 202 Lincoln Ave NW
- 1017 Clinton Ave SW
- 921 Camden Ave SW
- 1215 Dueber Ave SW
- 1016 Clinton Ave SW
- 1227 Greenfield Ave SW
- 1219 Dueber Ave SW
- 304 Columbus Ave NW
- 639 Greenfield Ave SW
- 643 Greenfield Ave SW
- 627 Greenfield Ave SW
- 647 Greenfield Ave SW
- 621 Greenfield Ave SW
- 2115 7th St SW
- 634 Harrison Ave SW
- 638 Harrison Ave SW
- 628 Harrison Ave SW
- 626 Harrison Ave SW
- 640 Harrison Ave SW
- 636 Greenfield Ave SW
- 642 Greenfield Ave SW
- 632 Greenfield Ave SW
- 617 Greenfield Ave SW
- 624 Harrison Ave SW
- 644 Harrison Ave SW
- 626 Greenfield Ave SW
- 646 Greenfield Ave SW
- 622 Harrison Ave SW