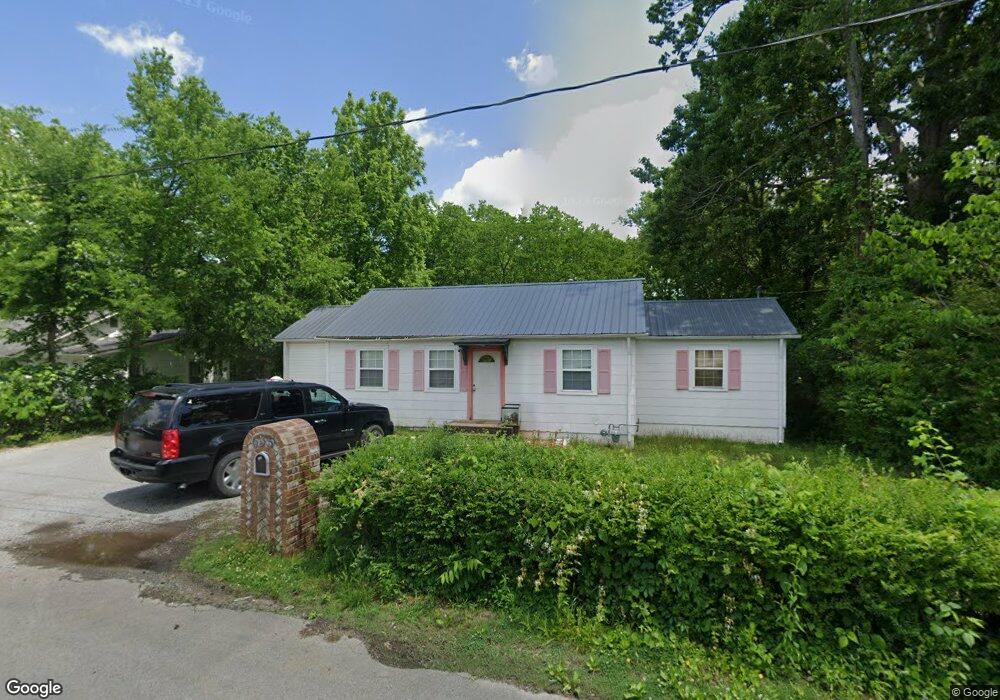
635 Landers St Shelbyville, TN 37160
Estimated Value: $142,669 - $190,000
--
Bed
1
Bath
1,280
Sq Ft
$125/Sq Ft
Est. Value
About This Home
This home is located at 635 Landers St, Shelbyville, TN 37160 and is currently estimated at $160,167, approximately $125 per square foot. 635 Landers St is a home located in Bedford County with nearby schools including East Side Elementary School, Harris Middle School, and Christian Chapel Academy.
Ownership History
Date
Name
Owned For
Owner Type
Purchase Details
Closed on
Nov 12, 2013
Sold by
Chyke David Richard
Bought by
Munoz Yeraldin
Current Estimated Value
Home Financials for this Owner
Home Financials are based on the most recent Mortgage that was taken out on this home.
Original Mortgage
$50,510
Outstanding Balance
$37,673
Interest Rate
4.31%
Mortgage Type
Commercial
Estimated Equity
$122,495
Purchase Details
Closed on
Jan 11, 2002
Sold by
Chyke David R
Bought by
Chyke David R and Chyke Ruth L
Purchase Details
Closed on
Aug 23, 1999
Sold by
Chyke Joel M Timothy
Bought by
Chyke David R
Purchase Details
Closed on
May 20, 1998
Bought by
Chyke Joel M and Chyke Timothy D
Purchase Details
Closed on
Nov 22, 1997
Sold by
Chemical Mort Corp
Bought by
H U D
Purchase Details
Closed on
Jun 25, 1996
Bought by
Secretary Of Housing & Urban Dev
Purchase Details
Closed on
Mar 24, 1989
Bought by
Johnson Robert Lee
Purchase Details
Closed on
Jul 17, 1985
Bought by
Jones Mark A and Jones Tammie R
Create a Home Valuation Report for This Property
The Home Valuation Report is an in-depth analysis detailing your home's value as well as a comparison with similar homes in the area
Home Values in the Area
Average Home Value in this Area
Purchase History
| Date | Buyer | Sale Price | Title Company |
|---|---|---|---|
| Munoz Yeraldin | $50,000 | -- | |
| Chyke David R | -- | -- | |
| Chyke David R | $31,500 | -- | |
| Chyke Joel M | $15,100 | -- | |
| H U D | $42,737 | -- | |
| Secretary Of Housing & Urban Dev | $42,700 | -- | |
| Johnson Robert Lee | -- | -- | |
| Jones Mark A | -- | -- |
Source: Public Records
Mortgage History
| Date | Status | Borrower | Loan Amount |
|---|---|---|---|
| Open | Munoz Yeraldin | $50,510 |
Source: Public Records
Tax History Compared to Growth
Tax History
| Year | Tax Paid | Tax Assessment Tax Assessment Total Assessment is a certain percentage of the fair market value that is determined by local assessors to be the total taxable value of land and additions on the property. | Land | Improvement |
|---|---|---|---|---|
| 2025 | -- | $25,125 | $0 | $0 |
| 2024 | -- | $25,125 | $5,175 | $19,950 |
| 2023 | $956 | $25,125 | $5,175 | $19,950 |
| 2022 | $983 | $25,125 | $5,175 | $19,950 |
| 2021 | $893 | $25,125 | $5,175 | $19,950 |
| 2020 | $521 | $25,125 | $5,175 | $19,950 |
| 2019 | $521 | $11,750 | $2,750 | $9,000 |
| 2018 | $509 | $11,750 | $2,750 | $9,000 |
| 2017 | $509 | $11,750 | $2,750 | $9,000 |
| 2016 | $504 | $11,750 | $2,750 | $9,000 |
| 2015 | $504 | $11,750 | $2,750 | $9,000 |
| 2014 | $477 | $12,175 | $0 | $0 |
Source: Public Records
Map
Nearby Homes
- 709 Belmont Ave
- 120 Dogwood Ct
- 220 Walnut St
- 102 Germantown Rd
- 222 Carter St
- 211 S Fairoak St
- 0 E Depot St
- 215 Coney Island Rd
- 112 Elizabeth St
- 207 Martha St
- 314 Maplewood Dr
- 464 Whitthorne St
- 627 E Lane St
- 631 E Lane St
- 107 Rockwood Dr
- 527 Deery St
- 418 Riverview Dr
- 611 Coble Cir
- 713 King Ave
- 714 King Ave