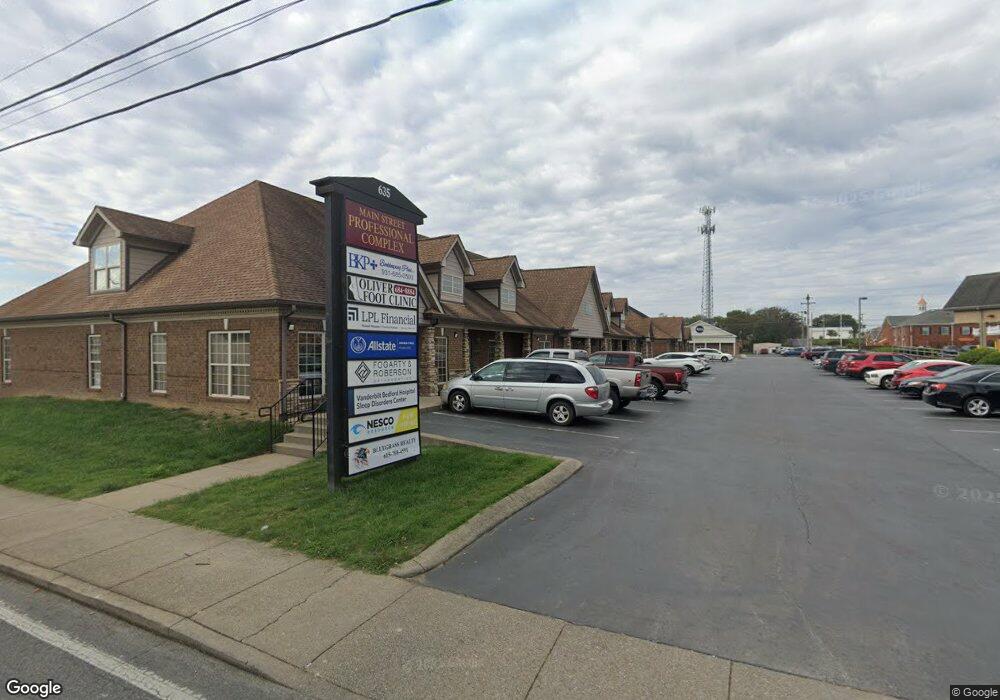
635 N Main St Shelbyville, TN 37160
Estimated Value: $566,760
--
Bed
3
Baths
1,920
Sq Ft
$295/Sq Ft
Est. Value
About This Home
This home is located at 635 N Main St, Shelbyville, TN 37160 and is currently estimated at $566,760, approximately $295 per square foot. 635 N Main St is a home located in Bedford County with nearby schools including Eakin Elementary School, Harris Middle School, and Victory Baptist Academy.
Ownership History
Date
Name
Owned For
Owner Type
Purchase Details
Closed on
Nov 30, 2018
Sold by
Patel Prakashchaudra B and Patel Mital K
Bought by
Kajalkrishnadev Investments Llc
Current Estimated Value
Home Financials for this Owner
Home Financials are based on the most recent Mortgage that was taken out on this home.
Original Mortgage
$252,000
Outstanding Balance
$93,187
Interest Rate
4.8%
Mortgage Type
Commercial
Estimated Equity
$473,573
Purchase Details
Closed on
Jun 26, 2014
Sold by
Parsons Rodney
Bought by
Parsons Rodney and Adams Lynette
Purchase Details
Closed on
Aug 4, 2011
Bought by
Patel Prakashchandra B and Patel Mital K
Purchase Details
Closed on
Dec 3, 2010
Bought by
Ms Fewel Richard D Dds and Fogarty Christopher P
Purchase Details
Closed on
Dec 30, 2009
Bought by
O'Neal Daryl M and O'Neal Amanda
Purchase Details
Closed on
Nov 23, 2009
Sold by
Parsons Rodney
Bought by
Oliver Russell W
Purchase Details
Closed on
Nov 15, 1978
Bought by
City Of Shelbyville
Create a Home Valuation Report for This Property
The Home Valuation Report is an in-depth analysis detailing your home's value as well as a comparison with similar homes in the area
Home Values in the Area
Average Home Value in this Area
Purchase History
| Date | Buyer | Sale Price | Title Company |
|---|---|---|---|
| Kajalkrishnadev Investments Llc | -- | None Available | |
| Parsons Rodney | -- | -- | |
| Patel Prakashchandra B | $295,600 | -- | |
| Ms Fewel Richard D Dds | $196,800 | -- | |
| O'Neal Daryl M | $150,300 | -- | |
| Oliver Russell W | $212,500 | -- | |
| City Of Shelbyville | -- | -- |
Source: Public Records
Mortgage History
| Date | Status | Borrower | Loan Amount |
|---|---|---|---|
| Open | Kajalkrishnadev Investments Llc | $252,000 |
Source: Public Records
Tax History Compared to Growth
Tax History
| Year | Tax Paid | Tax Assessment Tax Assessment Total Assessment is a certain percentage of the fair market value that is determined by local assessors to be the total taxable value of land and additions on the property. | Land | Improvement |
|---|---|---|---|---|
| 2025 | -- | $104,880 | $0 | $0 |
| 2024 | -- | $104,880 | $19,440 | $85,440 |
| 2023 | $3,991 | $104,880 | $19,440 | $85,440 |
| 2022 | $4,107 | $104,880 | $19,440 | $85,440 |
| 2021 | $3,729 | $104,880 | $19,440 | $85,440 |
| 2020 | $5,151 | $104,880 | $19,440 | $85,440 |
| 2019 | $5,151 | $116,280 | $19,440 | $96,840 |
| 2018 | $5,035 | $116,280 | $19,440 | $96,840 |
| 2017 | $5,035 | $116,280 | $19,440 | $96,840 |
| 2016 | $4,988 | $116,280 | $19,440 | $96,840 |
| 2015 | $4,988 | $116,280 | $19,440 | $96,840 |
| 2014 | $3,389 | $86,446 | $0 | $0 |
Source: Public Records
Map
Nearby Homes
- 0 Hilltop Rd Unit RTC2897754
- 0 Hilltop Rd Unit RTC3001632
- 527 Deery St
- 636 Deery St
- 1000 Woodbury St
- 703 Deery St
- 724 Alton Ave
- 713 King Ave
- 112 E Cedar St
- 714 King Ave
- 0 E Depot St
- 464 Whitthorne St
- 220 Walnut St
- 1017 Fairfield Pike
- 627 E Lane St
- 631 E Lane St
- 130 Horseshoe Dr
- 102 Saddlewood Dr
- 216 Celebration St
- 610 Sundance St
- 612 Del Ray St
- 612 Delray St
- 610 Del Ray St
- 605 Del Ray St
- 627 N Main St
- 2585 U S 41a
- 0 U S 41a
- 106 Elm St
- 710 N Brittain St
- 807 N Jefferson St
- 208 Elm St
- 209 Madison St
- 207 Madison St
- 712 N Main St
- 618 N Brittain St
- 709 N Jefferson St
- 705 N Jefferson St
- 703 N Jefferson St
- 616 N Brittain St
- 211 Madison St Unit 1