NOT LISTED FOR SALE

635 NE Boston Pkwy Waukee, IA 50263

Estimated Value: $471,802 - $521,000

-- Bed
4 Baths
1,625 Sq Ft
$303/Sq Ft Est. Value

Last Sold October 06, 2016

Last sale price $369,454 $227 Per Sq Ft

Est. 33% increase in value since last sale

Current estimated payment $3,201/month

About This Home

As of October 2016

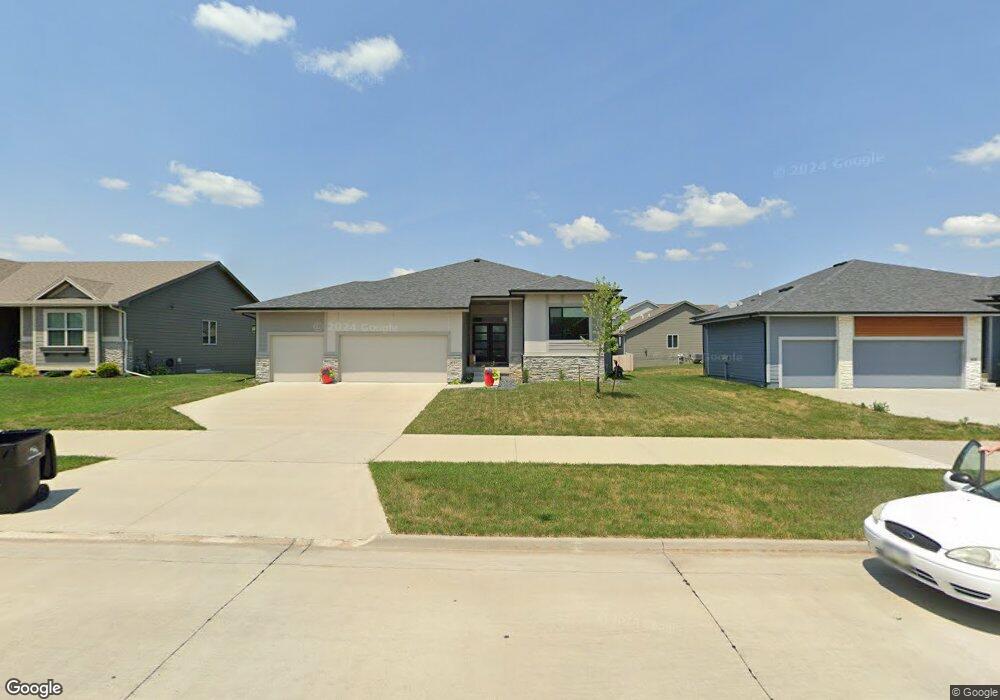
This home is located at 635 NE Boston Pkwy, Waukee, IA 50263 and is currently estimated at $492,951, approximately $303 per square foot. 635 NE Boston Pkwy is a home located in Dallas County with nearby schools including Grant Ragan Elementary and Waukee Middle School.

Ownership History

Date Name Owned For Owner Type

Purchase Details

Listed on
Jun 9, 2016
Closed on
Sep 30, 2016
Sold by
Destiny Homes Llc
Bought by
Balla Subrahmanyam and Kasina Srujana
Seller's Agent
Linda Westergaard
RE/MAX Precision
Buyer's Agent
Helen Priest
Iowa Realty Jordan Creek
List Price
$359,956
Sold Price
$369,454
Premium/Discount to List
$9,499
2.64%
Current Estimated Value
$492,951

Home Financials for this Owner

Home Financials are based on the most recent Mortgage that was taken out on this home.
Estimated Appreciation
$123,497
Avg. Annual Appreciation
3.23%
Original Mortgage
$332,508
Outstanding Balance
$266,314
Interest Rate
3.43%
Mortgage Type
New Conventional
Estimated Equity
$226,637

Purchase Details

Closed on
Feb 12, 2016
Sold by
Landing At Shadow Creek Llc
Bought by
Destiny Homes Llc
Source: Public Records

Range of Values:

Collateral Analytics

Collateral Analytics Collateral Analytics AVMs (Automated Valuation Model) employ a number of statistical approaches combined with neighborhood-specific comparable selection guarantees the most up-to-date and precise valuations.

Not Available

Collateral Analytics does not have data for the current month. Please view the chart for historical values.

ICE

ICE Mortgage Technology ICE Mortgage Technology’s AVM (Automated Valuation Model) is a state-of-the-art online residential property valuation tool that provides a quick and accurate estimate of the value of almost any home in the U.S.

Not Available

ICE Mortgage Technology does not have data for the current month. Please view the chart for historical values.

First American

First American First American Data & Analytics’ next-generation AVM combines unrivaled data assets with a blended ensemble of valuation models to produce highly accurate, reliable valuations you can trust.

Not Available

First American does not have data for the current month. Please view the chart for historical values.

Quantarium

Quantarium Quantarium’s valuation service, repeatedly proven the industry’s most accurate and comprehensive, is supercharged with a self-learning and auto-tuning AI engine that continually becomes smarter and more accurate as it processes daily inputs from the industry’s leading RE data lake.

Not Available

Quantarium does not have data for the current month. Please view the chart for historical values.

Average Value
Not Available
List Price
Sold Price
Create a Home Valuation Report for This Property
The Home Valuation Report is an in-depth analysis detailing your home's value as well as a comparison with similar homes in the area

Home Values in the Area

Source: Public Records

Average Home Value in this Area


Source: Public Records

Purchase History

Date Buyer Sale Price Title Company
Balla Subrahmanyam $369,500 None Available
Destiny Homes Llc $131,750 None Available
Source: Public Records

Mortgage History

Date Status Borrower Loan Amount
Open Balla Subrahmanyam $332,508
Source: Public Records

Property History

Date Event Price List to Sale Price per Sq Ft Prior Sale
10/06/2016 10/06/16 Sold $369,454 +2.6% $227 / Sq Ft View Prior Sale
09/15/2016 09/15/16 Pending -- -- --
06/09/2016 06/09/16 For Sale $359,956 -- $222 / Sq Ft

Tax History Compared to Growth

Source: Public Records

Tax History

Year Tax Paid Tax Assessment Tax Assessment Total Assessment is a certain percentage of the fair market value that is determined by local assessors to be the total taxable value of land and additions on the property. Land Improvement
2024 $7,382 $424,630 $80,000 $344,630
2023 $7,382 $424,630 $80,000 $344,630
2022 $6,878 $379,860 $80,000 $299,860
2021 $6,878 $357,750 $70,000 $287,750
2020 $6,980 $350,030 $70,000 $280,030
2019 $7,120 $350,030 $70,000 $280,030
2018 $7,120 $339,780 $70,000 $269,780
2017 $12 $347,510 $70,000 $277,510
2016 $0 $610 $610 $0
Source: Public Records

Agents Affiliated with this Home

  • Section Image
See All Agents

Map