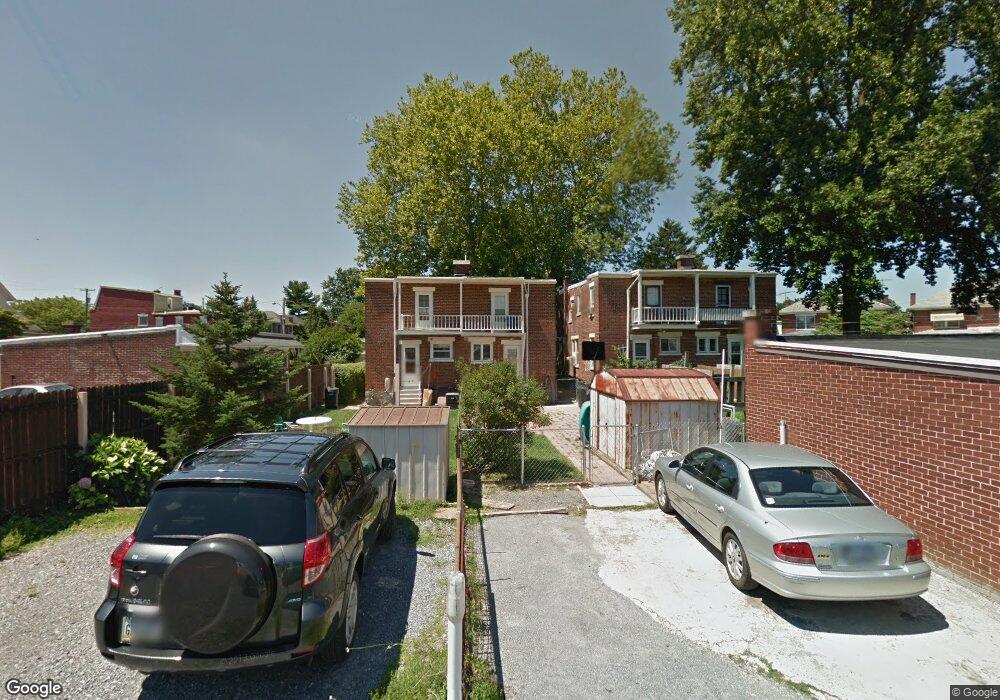
635 Pearl St Lancaster, PA 17603
West End NeighborhoodEstimated Value: $205,000 - $257,000
4
Beds
1
Bath
1,280
Sq Ft
$181/Sq Ft
Est. Value
About This Home
This home is located at 635 Pearl St, Lancaster, PA 17603 and is currently estimated at $231,982, approximately $181 per square foot. 635 Pearl St is a home located in Lancaster County with nearby schools including Smith-Wade-El Elementary School, Wheatland Middle School, and McCaskey High School.
Ownership History
Date
Name
Owned For
Owner Type
Purchase Details
Closed on
Jun 23, 2020
Sold by
Dejesus Anissa J and Dejesus Rafael
Bought by
Dejesus Anissa J
Current Estimated Value
Purchase Details
Closed on
Feb 12, 2014
Sold by
Dejesus Anissa J
Bought by
Dejesus Anissa J and Dejesus Rafael
Home Financials for this Owner
Home Financials are based on the most recent Mortgage that was taken out on this home.
Original Mortgage
$78,750
Interest Rate
4.5%
Mortgage Type
New Conventional
Create a Home Valuation Report for This Property
The Home Valuation Report is an in-depth analysis detailing your home's value as well as a comparison with similar homes in the area
Home Values in the Area
Average Home Value in this Area
Purchase History
| Date | Buyer | Sale Price | Title Company |
|---|---|---|---|
| Dejesus Anissa J | -- | None Available | |
| Dejesus Anissa J | -- | None Available |
Source: Public Records
Mortgage History
| Date | Status | Borrower | Loan Amount |
|---|---|---|---|
| Closed | Dejesus Anissa J | $78,750 |
Source: Public Records
Tax History Compared to Growth
Tax History
| Year | Tax Paid | Tax Assessment Tax Assessment Total Assessment is a certain percentage of the fair market value that is determined by local assessors to be the total taxable value of land and additions on the property. | Land | Improvement |
|---|---|---|---|---|
| 2025 | $3,791 | $95,800 | $23,500 | $72,300 |
| 2024 | $3,791 | $95,800 | $23,500 | $72,300 |
| 2023 | $3,727 | $95,800 | $23,500 | $72,300 |
| 2022 | $3,572 | $95,800 | $23,500 | $72,300 |
| 2021 | $3,495 | $95,800 | $23,500 | $72,300 |
| 2020 | $3,495 | $95,800 | $23,500 | $72,300 |
| 2019 | $3,443 | $95,800 | $23,500 | $72,300 |
| 2018 | $4,011 | $95,800 | $23,500 | $72,300 |
| 2017 | $3,091 | $67,300 | $16,300 | $51,000 |
| 2016 | $3,063 | $67,300 | $16,300 | $51,000 |
| 2015 | $1,195 | $67,300 | $16,300 | $51,000 |
| 2014 | $2,246 | $67,300 | $16,300 | $51,000 |
Source: Public Records
Map
Nearby Homes