B
Landlord's Agent in 2020
Brandon Whitman
Keller Williams Realty
Estimated Value: $665,000 - $840,980
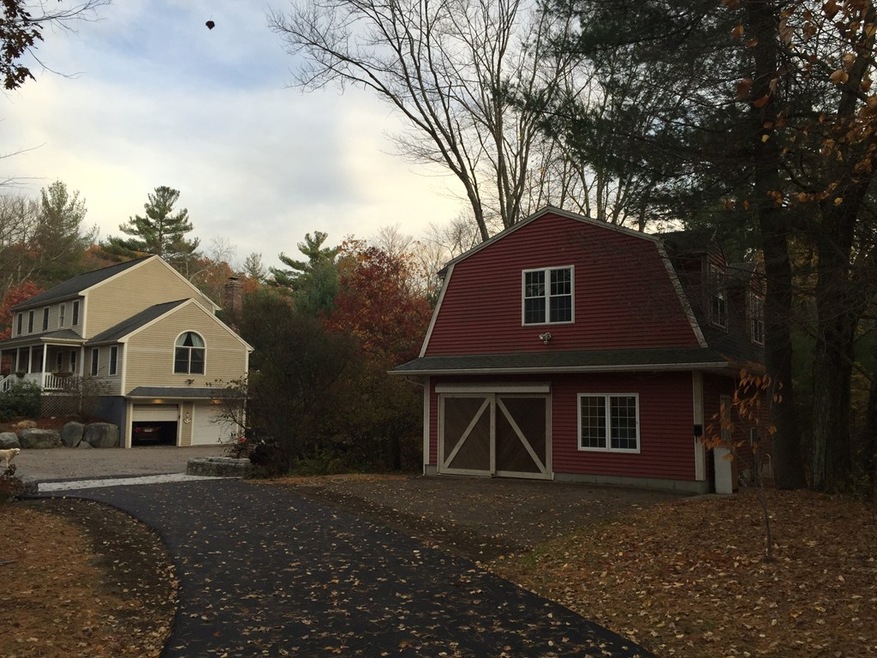
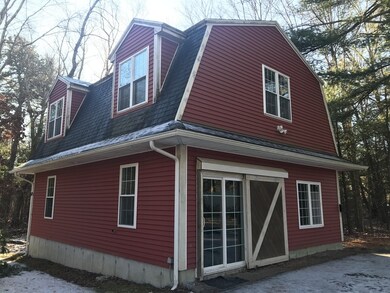
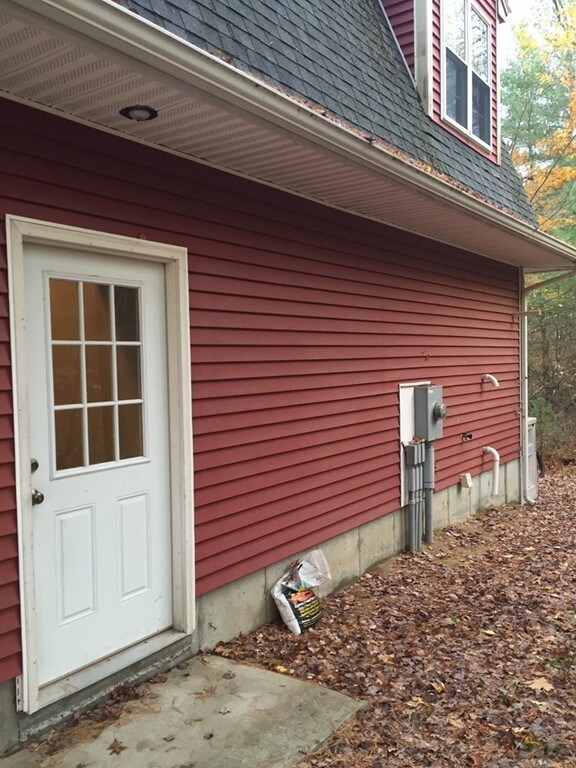
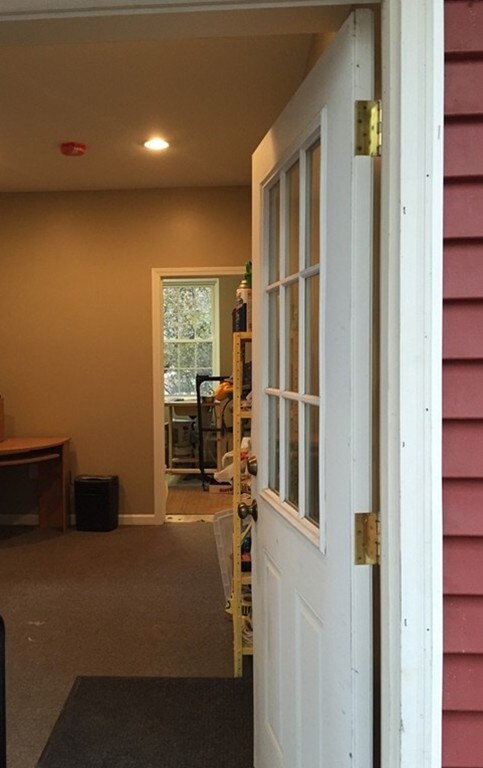
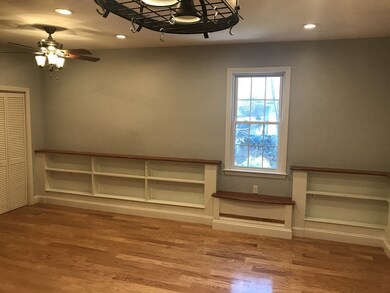
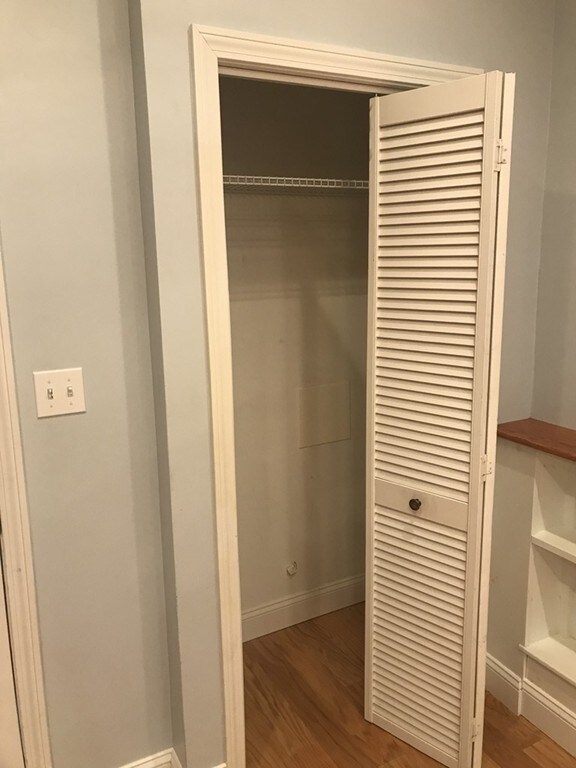
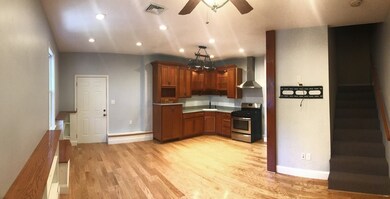
Unique Opportunity! Currently looking for qualified renters for 1300 square foot gambrel home quietly tucked back 400ft off of main road on 5 acre property. Best of both worlds! You have your own single family detached home, but your snow removal and landscaping are taking care of by someone else! Washer and dryer included in home on first floor. Wall mount for TV in dining/living area. Propane for heat, hot water and stove. All high efficiency appliances and lighting. On demand endless hot water. Both bedrooms and full bath are upstairs with nice views of nature and the property. Apartment was built in 2014 so everything is still practically brand new. Based on needs of qualified renters property could also easily be converted into a 3 bedroom 1.5 bath. Central air could also be added easily and could be discussed with potential renter. You won't find another situation like this any time soon, come see it!
Last Agent to Rent the Property
Brandon Whitman
Keller Williams Realty Listed on: 11/25/2019

Last Renter's Agent
Brandon Whitman
Keller Williams Realty Listed on: 11/25/2019
| Date | Event | Price | List to Sale | Price per Sq Ft |
|---|---|---|---|---|
| 02/01/2020 02/01/20 | Rented | $2,000 | +5.3% | -- |
| 12/31/2019 12/31/19 | Price Changed | $1,900 | -5.0% | $1 / Sq Ft |
| 11/25/2019 11/25/19 | For Rent | $2,000 | -- | -- |
| Year | Tax Paid | Tax Assessment Tax Assessment Total Assessment is a certain percentage of the fair market value that is determined by local assessors to be the total taxable value of land and additions on the property. | Land | Improvement |
|---|---|---|---|---|
| 2025 | $10,328 | $822,300 | $164,300 | $658,000 |
| 2024 | $9,518 | $740,100 | $150,000 | $590,100 |
| 2023 | $9,166 | $702,400 | $142,800 | $559,600 |
| 2022 | $9,167 | $651,100 | $123,200 | $527,900 |
| 2021 | $8,767 | $608,400 | $123,200 | $485,200 |
| 2020 | $8,039 | $565,300 | $123,200 | $442,100 |
| 2019 | $7,814 | $549,900 | $123,200 | $426,700 |
| 2018 | $7,270 | $504,500 | $124,100 | $380,400 |
| 2017 | $7,285 | $508,000 | $124,100 | $383,900 |
| 2016 | $6,999 | $489,800 | $129,000 | $360,800 |
| 2015 | $5,255 | $368,800 | $124,100 | $244,700 |
| 2014 | $5,220 | $356,100 | $120,600 | $235,500 |
B
Landlord's Agent in 2020
Brandon Whitman
Keller Williams Realty
Source: MLS Property Information Network (MLS PIN)
MLS Number: 72595933
APN: BELL-000087-000063A
Disclaimer: Certain information contained herein is derived from information provided by parties other than Homes.com. All information provided is deemed reliable, but is not guaranteed to be accurate and should be independently verified.
![]() The property listing data and information, or the Images, set forth herein were provided to MLS Property Information Network, Inc. from third party sources, including sellers, lessors and public records, and were compiled by MLS Property Information Network, Inc. The property listing data and information, and the Images, are for the personal, non-commercial use of consumers having a good faith interest in purchasing or leasing listed properties of the type displayed to them and may not be used for any purpose other than to identify prospective properties which such consumers may have a good faith interest in purchasing or leasing. MLS Property Information Network, Inc. and its subscribers disclaim any and all representations and warranties as to the accuracy of the property listing data and information, or as to the accuracy of any of the Images, set forth herein.
The property listing data and information, or the Images, set forth herein were provided to MLS Property Information Network, Inc. from third party sources, including sellers, lessors and public records, and were compiled by MLS Property Information Network, Inc. The property listing data and information, and the Images, are for the personal, non-commercial use of consumers having a good faith interest in purchasing or leasing listed properties of the type displayed to them and may not be used for any purpose other than to identify prospective properties which such consumers may have a good faith interest in purchasing or leasing. MLS Property Information Network, Inc. and its subscribers disclaim any and all representations and warranties as to the accuracy of the property listing data and information, or as to the accuracy of any of the Images, set forth herein.