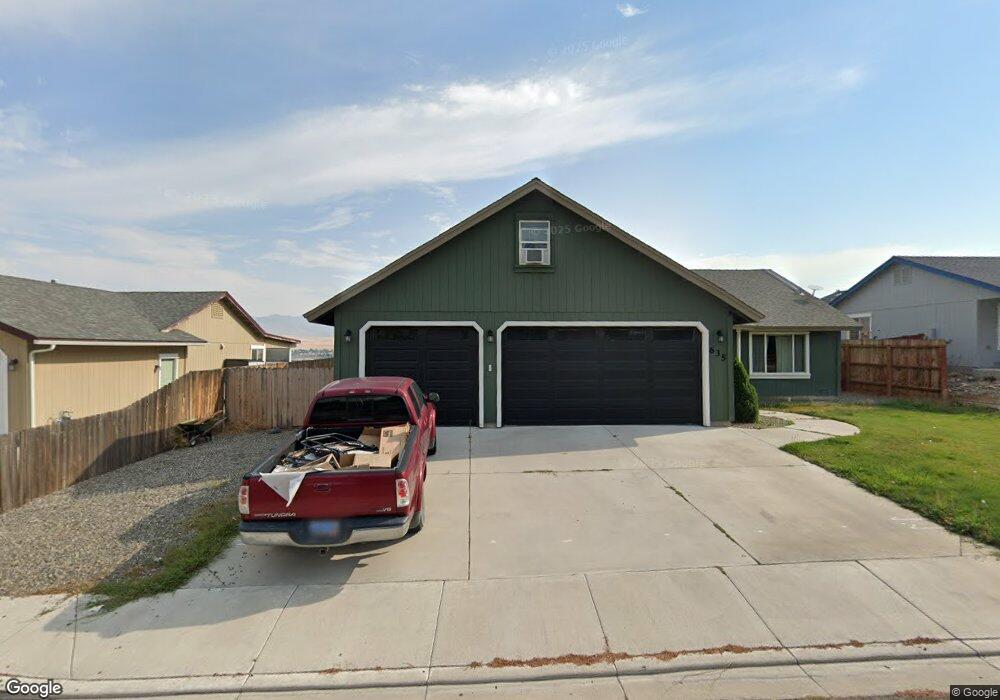
635 Ross St Winnemucca, NV 89445
Estimated Value: $374,000 - $488,000
3
Beds
2
Baths
1,993
Sq Ft
$223/Sq Ft
Est. Value
About This Home
This home is located at 635 Ross St, Winnemucca, NV 89445 and is currently estimated at $444,353, approximately $222 per square foot. 635 Ross St is a home with nearby schools including Winnemucca Grammar School, Winnemucca Junior High School, and French Ford Middle School.
Ownership History
Date
Name
Owned For
Owner Type
Purchase Details
Closed on
Aug 30, 2012
Sold by
Baker Jillian A
Bought by
Baker Glen Colin
Current Estimated Value
Purchase Details
Closed on
Feb 13, 2012
Sold by
Schade Construction Inc and Smith Harold J
Bought by
Baker Glen Colin
Home Financials for this Owner
Home Financials are based on the most recent Mortgage that was taken out on this home.
Original Mortgage
$238,691
Interest Rate
3.49%
Mortgage Type
FHA
Create a Home Valuation Report for This Property
The Home Valuation Report is an in-depth analysis detailing your home's value as well as a comparison with similar homes in the area
Home Values in the Area
Average Home Value in this Area
Purchase History
| Date | Buyer | Sale Price | Title Company |
|---|---|---|---|
| Baker Glen Colin | -- | First American Title Spar | |
| Baker Glen Colin | $244,900 | First American Title Spar |
Source: Public Records
Mortgage History
| Date | Status | Borrower | Loan Amount |
|---|---|---|---|
| Previous Owner | Baker Glen Colin | $238,691 |
Source: Public Records
Tax History Compared to Growth
Tax History
| Year | Tax Paid | Tax Assessment Tax Assessment Total Assessment is a certain percentage of the fair market value that is determined by local assessors to be the total taxable value of land and additions on the property. | Land | Improvement |
|---|---|---|---|---|
| 2025 | $3,468 | $109,360 | $12,250 | $97,110 |
| 2024 | $3,284 | $109,543 | $12,250 | $97,292 |
| 2023 | $3,284 | $99,777 | $10,675 | $89,102 |
| 2022 | $2,831 | $85,854 | $10,675 | $75,179 |
| 2021 | $2,821 | $85,529 | $10,675 | $74,854 |
| 2020 | $2,859 | $86,832 | $10,675 | $76,157 |
| 2019 | $2,763 | $83,715 | $10,675 | $73,040 |
| 2018 | $2,704 | $81,850 | $10,675 | $71,175 |
| 2017 | $2,697 | $81,626 | $10,675 | $70,951 |
| 2016 | $2,742 | $82,714 | $10,675 | $72,039 |
| 2015 | $266 | $81,793 | $10,675 | $71,118 |
| 2014 | $266 | $77,858 | $8,575 | $69,283 |
Source: Public Records
Map
Nearby Homes