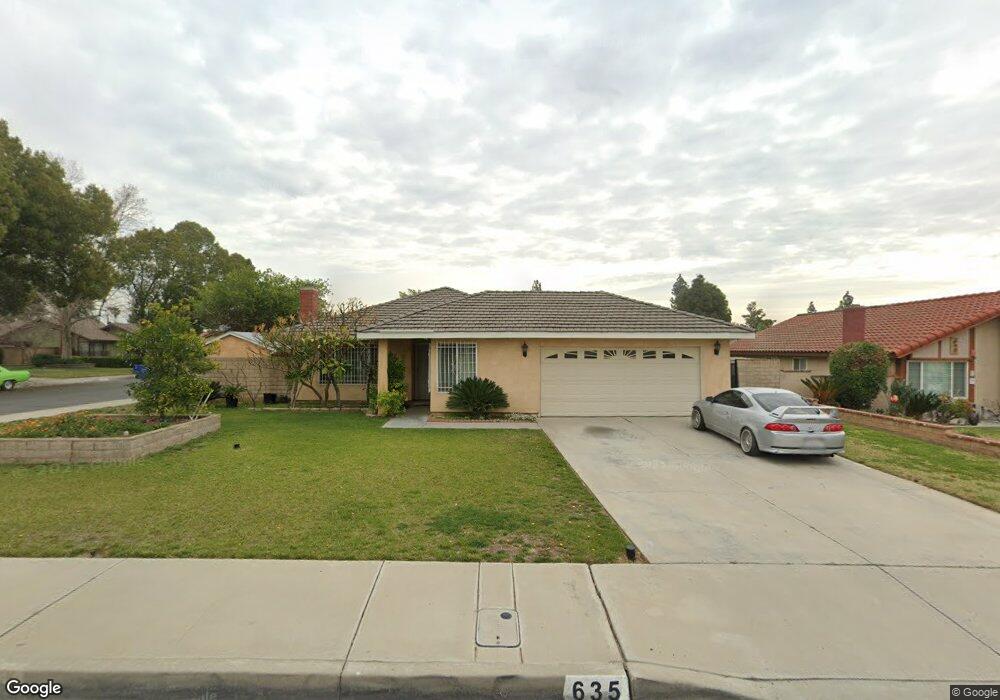
635 S Aspen Ave Bloomington, CA 92316
Estimated Value: $623,000 - $715,000
5
Beds
2
Baths
2,191
Sq Ft
$302/Sq Ft
Est. Value
About This Home
This home is located at 635 S Aspen Ave, Bloomington, CA 92316 and is currently estimated at $661,779, approximately $302 per square foot. 635 S Aspen Ave is a home located in San Bernardino County with nearby schools including Maple Elementary School, Alder Middle School, and Jurupa Hills High School.
Ownership History
Date
Name
Owned For
Owner Type
Purchase Details
Closed on
May 7, 2021
Sold by
Carlos Juan Miguel and Carlos Claudia Luqa
Bought by
Carlos Jesus Salinas and Carlos Gloria
Current Estimated Value
Purchase Details
Closed on
Jun 7, 2017
Sold by
Carlos Jesus Salinas and Carlos Gloria
Bought by
Haro Carlos Claudia Lucia and Haro Carlos Jr Jesus
Purchase Details
Closed on
Apr 7, 1999
Sold by
Castro Julio C and Castro Carlos Maria
Bought by
Carlos Jesus S and Carlos Gloria
Purchase Details
Closed on
Jul 10, 1997
Sold by
Hud
Bought by
Castro Julio C and Castro Carlos Maria
Home Financials for this Owner
Home Financials are based on the most recent Mortgage that was taken out on this home.
Original Mortgage
$89,760
Interest Rate
7.45%
Mortgage Type
FHA
Purchase Details
Closed on
Apr 14, 1997
Sold by
Union Planters National Mtg
Bought by
Hud
Purchase Details
Closed on
Feb 14, 1997
Sold by
Montes Samuel and Montes Diana
Bought by
Union Planters National Mtg and Leader Federal Bank For Svgs
Create a Home Valuation Report for This Property
The Home Valuation Report is an in-depth analysis detailing your home's value as well as a comparison with similar homes in the area
Home Values in the Area
Average Home Value in this Area
Purchase History
| Date | Buyer | Sale Price | Title Company |
|---|---|---|---|
| Carlos Jesus Salinas | -- | None Available | |
| Haro Carlos Claudia Lucia | -- | None Available | |
| Carlos Jesus S | -- | -- | |
| Castro Julio C | $90,500 | Orange Coast Title | |
| Hud | -- | Fidelity National Title Ins | |
| Union Planters National Mtg | $155,057 | United Title Company |
Source: Public Records
Mortgage History
| Date | Status | Borrower | Loan Amount |
|---|---|---|---|
| Previous Owner | Castro Julio C | $89,760 |
Source: Public Records
Tax History Compared to Growth
Tax History
| Year | Tax Paid | Tax Assessment Tax Assessment Total Assessment is a certain percentage of the fair market value that is determined by local assessors to be the total taxable value of land and additions on the property. | Land | Improvement |
|---|---|---|---|---|
| 2025 | $2,374 | $208,169 | $39,192 | $168,977 |
| 2024 | $2,374 | $204,088 | $38,424 | $165,664 |
| 2023 | $2,341 | $200,087 | $37,671 | $162,416 |
| 2022 | $2,345 | $196,163 | $36,932 | $159,231 |
| 2021 | $2,314 | $192,317 | $36,208 | $156,109 |
| 2020 | $2,328 | $190,345 | $35,837 | $154,508 |
| 2019 | $2,260 | $186,612 | $35,134 | $151,478 |
| 2018 | $2,301 | $182,953 | $34,445 | $148,508 |
| 2017 | $2,283 | $179,366 | $33,770 | $145,596 |
| 2016 | $2,261 | $175,849 | $33,108 | $142,741 |
| 2015 | $2,231 | $173,208 | $32,611 | $140,597 |
| 2014 | $2,225 | $169,815 | $31,972 | $137,843 |
Source: Public Records
Map
Nearby Homes
- 1459 W James St
- 1157 W Orchard St
- 1560 W Athol St
- 1510 W Merrill Ave
- 806 S Sandalwood Ave
- 18264 Pine Ave Unit a & B
- 18264 Pine Ave
- 9050 Dumond Dr
- 1228 W Woodcrest St
- 18239 Orange Way
- 687 S Mandarin Ln
- 1028 W Woodcrest St
- 646 S Fillmore Ave
- 8795 Frankfort St
- 687 S Fillmore Ave
- 1154 S Spruce Ave
- 17962 Merrill Ave
- 703 W Montrose St
- 778 Bloomington Ave
- 18100 Arrow Blvd
- 647 N Aspen Ave
- 638 S Wisteria Ave
- 650 Wisteria Ave
- 650 S Wisteria Ave
- 659 N Aspen Ave
- 1354 W Orchard St
- 1366 W Orchard St
- 636 S Aspen Ave
- 662 S Wisteria Ave
- 1340 W Orchard St
- 648 S Aspen Ave
- 1380 W Orchard St
- 671 S Aspen Ave
- 1326 W Orchard St
- 674 S Wisteria Ave
- 1396 W Orchard St
- 672 S Aspen Ave
- 683 S Aspen Ave
- 625 S Smoketree Ave
- 637 S Smoketree Ave