Estimated Value: $502,000 - $607,000
--
Bed
3
Baths
1,671
Sq Ft
$338/Sq Ft
Est. Value
About This Home
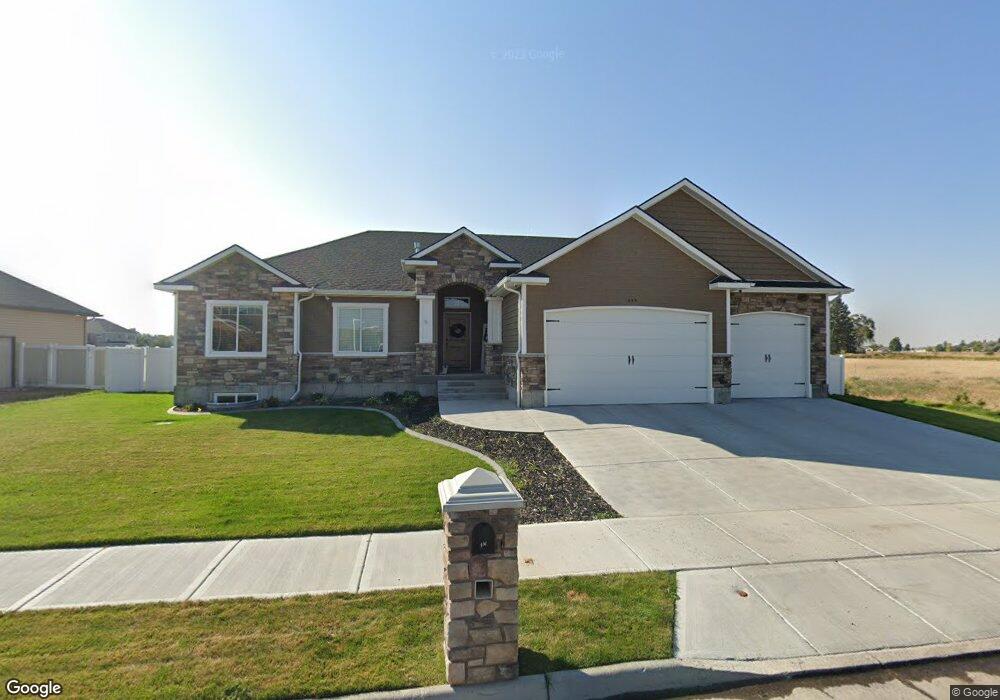
This home is located at 635 Sundance, Rigby, ID 83442 and is currently estimated at $564,869, approximately $338 per square foot. 635 Sundance is a home with nearby schools including Jefferson Elementary School, Rigby Middle School, and Rigby High School.
Ownership History
Date
Name
Owned For
Owner Type
Purchase Details
Closed on
Dec 19, 2019
Sold by
Webb Steven Clark and Webb Audrey Jan
Bought by
Smith Corey and Smith Erika
Current Estimated Value
Home Financials for this Owner
Home Financials are based on the most recent Mortgage that was taken out on this home.
Original Mortgage
$319,410
Outstanding Balance
$279,778
Interest Rate
3.6%
Mortgage Type
New Conventional
Estimated Equity
$285,091
Purchase Details
Closed on
Oct 18, 2016
Sold by
Stoker Scott and Stoker Dee
Bought by
Webb Steven Clark and Webb Jan
Home Financials for this Owner
Home Financials are based on the most recent Mortgage that was taken out on this home.
Original Mortgage
$250,211
Interest Rate
3.44%
Mortgage Type
New Conventional
Purchase Details
Closed on
May 8, 2012
Sold by
H & S Development Llc
Bought by
Stoker Scott and Stoker Dee
Create a Home Valuation Report for This Property
The Home Valuation Report is an in-depth analysis detailing your home's value as well as a comparison with similar homes in the area
Home Values in the Area
Average Home Value in this Area
Purchase History
| Date | Buyer | Sale Price | Title Company |
|---|---|---|---|
| Smith Corey | -- | Amerititle Idaho Falls | |
| Webb Steven Clark | -- | Alliance Title Rigby Office | |
| Stoker Scott | -- | None Available |
Source: Public Records
Mortgage History
| Date | Status | Borrower | Loan Amount |
|---|---|---|---|
| Open | Smith Corey | $319,410 | |
| Previous Owner | Webb Steven Clark | $250,211 |
Source: Public Records
Tax History
| Year | Tax Paid | Tax Assessment Tax Assessment Total Assessment is a certain percentage of the fair market value that is determined by local assessors to be the total taxable value of land and additions on the property. | Land | Improvement |
|---|---|---|---|---|
| 2025 | $2,762 | $549,477 | $0 | $0 |
| 2024 | $2,762 | $543,154 | $0 | $0 |
| 2023 | $3,568 | $544,855 | $0 | $0 |
| 2022 | $4,547 | $485,942 | $0 | $0 |
| 2021 | $4,283 | $383,845 | $0 | $0 |
| 2020 | $3,698 | $356,388 | $0 | $0 |
| 2019 | $3,973 | $316,385 | $0 | $0 |
| 2018 | $3,415 | $271,383 | $0 | $0 |
| 2017 | $3,242 | $255,472 | $0 | $0 |
| 2016 | $70 | $25,417 | $0 | $0 |
| 2015 | $73 | $3,444 | $0 | $0 |
| 2014 | $73 | $3,444 | $0 | $0 |
| 2013 | -- | $3,444 | $0 | $0 |
Source: Public Records
Map
Nearby Homes
Your Personal Tour Guide
Ask me questions while you tour the home.