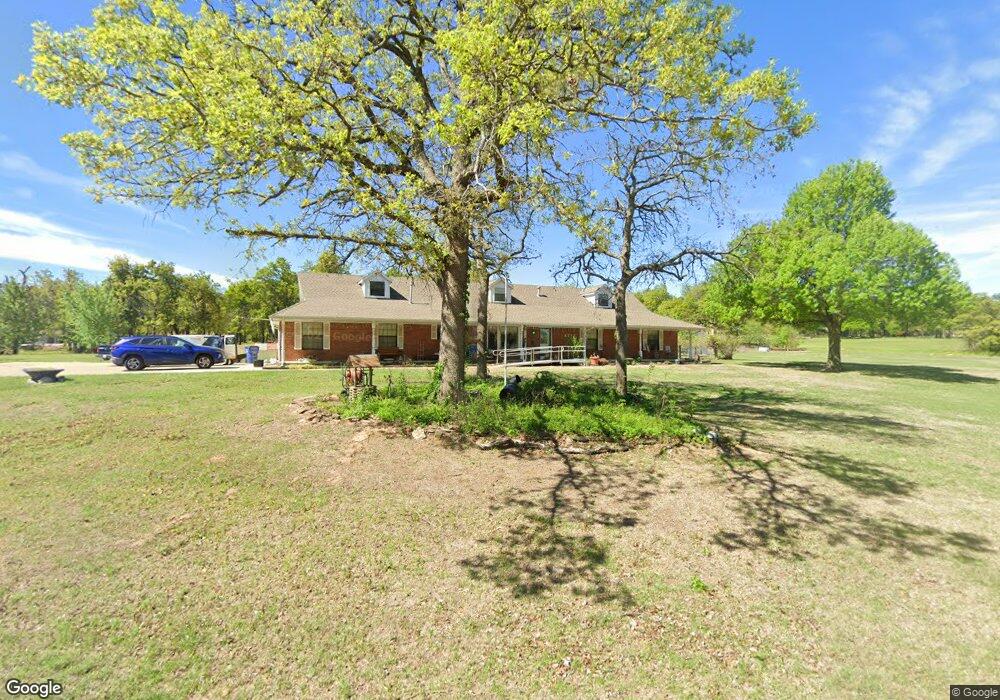
635 Turtle Creek Dr Choctaw, OK 73020
Estimated Value: $271,000 - $306,000
3
Beds
2
Baths
1,928
Sq Ft
$152/Sq Ft
Est. Value
About This Home
This home is located at 635 Turtle Creek Dr, Choctaw, OK 73020 and is currently estimated at $292,161, approximately $151 per square foot. 635 Turtle Creek Dr is a home located in Oklahoma County with nearby schools including Indian Meridian Elementary School, James Griffith Intermediate Elementary School, and Choctaw Middle School.
Ownership History
Date
Name
Owned For
Owner Type
Purchase Details
Closed on
Jan 9, 2018
Sold by
Littleton Michael Joe and Littleton Shaune
Bought by
M6 Investments Llc
Current Estimated Value
Home Financials for this Owner
Home Financials are based on the most recent Mortgage that was taken out on this home.
Original Mortgage
$292,500
Outstanding Balance
$248,824
Interest Rate
4.26%
Mortgage Type
Reverse Mortgage Home Equity Conversion Mortgage
Estimated Equity
$43,337
Purchase Details
Closed on
Sep 5, 2014
Sold by
Wright M L and Rogers Patti
Bought by
Farmer Robert and Farmer Joan
Purchase Details
Closed on
Feb 13, 1998
Sold by
Fisher Ernest L
Bought by
Wright M L and Rogers Patti
Purchase Details
Closed on
Sep 29, 1997
Sold by
Mantle Robert E and Mantle Glenda G
Bought by
Fisher Ernest L
Create a Home Valuation Report for This Property
The Home Valuation Report is an in-depth analysis detailing your home's value as well as a comparison with similar homes in the area
Home Values in the Area
Average Home Value in this Area
Purchase History
| Date | Buyer | Sale Price | Title Company |
|---|---|---|---|
| M6 Investments Llc | $44,000 | American Eagle Title Group | |
| Farmer Robert | $205,000 | Capitol Abstract & Title Co | |
| Wright M L | $105,000 | -- | |
| Fisher Ernest L | $108,000 | Stewart Escrow & Title |
Source: Public Records
Mortgage History
| Date | Status | Borrower | Loan Amount |
|---|---|---|---|
| Open | M6 Investments Llc | $292,500 |
Source: Public Records
Tax History Compared to Growth
Tax History
| Year | Tax Paid | Tax Assessment Tax Assessment Total Assessment is a certain percentage of the fair market value that is determined by local assessors to be the total taxable value of land and additions on the property. | Land | Improvement |
|---|---|---|---|---|
| 2024 | $2,221 | $19,965 | $3,181 | $16,784 |
| 2023 | $2,221 | $19,965 | $3,851 | $16,114 |
| 2022 | $2,184 | $19,965 | $3,802 | $16,163 |
| 2021 | $2,182 | $19,965 | $3,173 | $16,792 |
| 2020 | $2,191 | $19,965 | $3,565 | $16,400 |
| 2019 | $2,194 | $19,965 | $3,374 | $16,591 |
| 2018 | $2,197 | $19,965 | $0 | $0 |
| 2017 | $2,191 | $19,964 | $1,900 | $18,064 |
| 2016 | $2,201 | $19,964 | $1,895 | $18,069 |
| 2015 | $2,248 | $19,383 | $2,073 | $17,310 |
| 2014 | $1,955 | $17,875 | $2,073 | $15,802 |
Source: Public Records
Map
Nearby Homes
- 895 Choctaw Vista
- 17800 Piper Glen Dr
- 17771 Piper Glen Dr
- 1383 N Peebly Rd
- 151 S Peebly Rd
- 25 Woodlake Dr
- 18280 NE 10th St
- 680 Silver Tree Dr
- 0 Timber Ridge Dr
- 769 Silver Chase Dr
- 16651 Roserock Cir
- 16523 Roserock Cir
- 913 Reedser Way
- 16334 E Reno Ave
- 16441 Roserock Cir
- 16175 Silver Run Dr
- 17200 NE 23rd St
- 16406 Sandstone Cir
- 16470 Shelby St
- 18320 NE 23rd St
- 17425 Turtle Creek Dr
- 660 Turtle Creek Dr
- 17375 Turtle Creek Dr
- 600 Turtle Creek Dr
- 580 Turtle Creek Dr
- 700 Turtle Creek Dr
- 620 Turtle Creek Dr
- 680 Turtle Creek Dr
- 750 Turtle Creek Dr
- 17420 Turtle Creek Dr
- 780 Turtle Creek Dr
- 17400 Turtle Creek Dr
- 17360 Turtle Creek Dr
- 669 Choctaw Vista E
- 17350 Sunset Point
- 17330 Turtle Creek Dr
- 810 Turtle Creek Dr
- 643 Choctaw Vista W
- 773 W Choctaw Vista Unit W
- 773 W Choctaw Vista Unit W