635 W Main St Cookeville, TN 38506
Estimated Value: $5,380,883
--
Bed
5
Baths
5,953
Sq Ft
$904/Sq Ft
Est. Value
About This Home
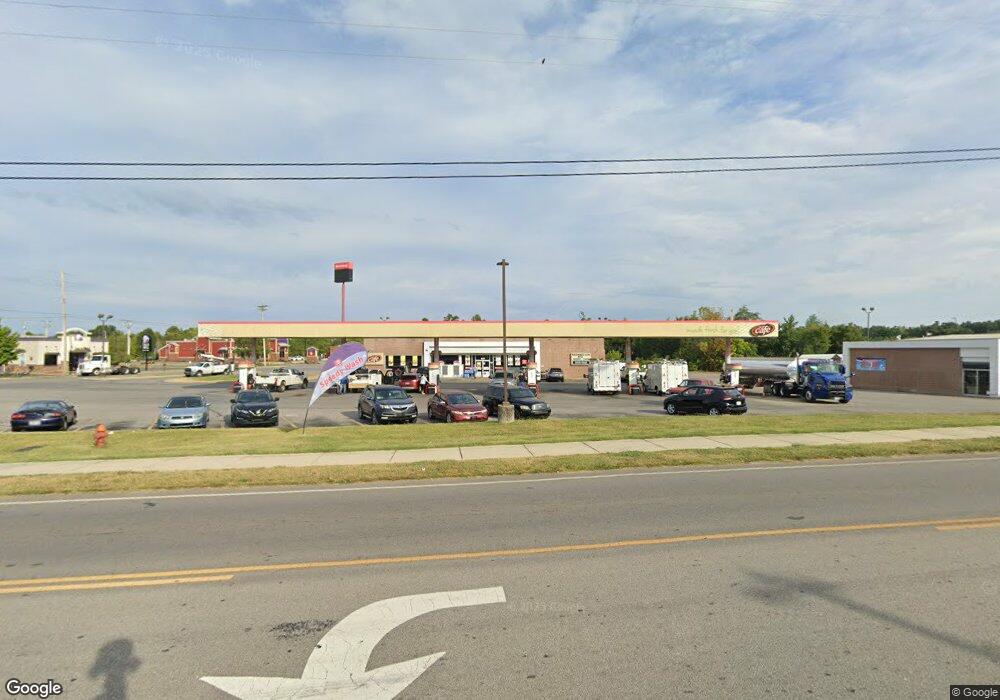
This home is located at 635 W Main St, Cookeville, TN 38506 and is currently estimated at $5,380,883, approximately $903 per square foot. 635 W Main St is a home located in Putnam County with nearby schools including Algood Elementary School, Algood Middle School, and Cookeville High School.
Ownership History
Date
Name
Owned For
Owner Type
Purchase Details
Closed on
Feb 26, 2013
Sold by
Clark Sherry Mcgugin
Bought by
Speedway Llc and C/O Real Estate Dept
Current Estimated Value
Purchase Details
Closed on
Jan 29, 2002
Sold by
Flp Redus
Bought by
Clark Sherry Mcgugin 1999
Purchase Details
Closed on
Sep 22, 2000
Bought by
Redus Family Limited Prtnrshp James L Smith
Purchase Details
Closed on
Sep 25, 1943
Bought by
Carr Haskel and Anna Lee
Create a Home Valuation Report for This Property
The Home Valuation Report is an in-depth analysis detailing your home's value as well as a comparison with similar homes in the area
Home Values in the Area
Average Home Value in this Area
Purchase History
| Date | Buyer | Sale Price | Title Company |
|---|---|---|---|
| Speedway Llc | $2,000,000 | -- | |
| Clark Sherry Mcgugin 1999 | $540,000 | -- | |
| Redus Family Limited Prtnrshp James L Smith | $630,000 | -- | |
| Carr Haskel | -- | -- |
Source: Public Records
Tax History Compared to Growth
Tax History
| Year | Tax Paid | Tax Assessment Tax Assessment Total Assessment is a certain percentage of the fair market value that is determined by local assessors to be the total taxable value of land and additions on the property. | Land | Improvement |
|---|---|---|---|---|
| 2024 | $13,373 | $502,760 | $247,600 | $255,160 |
| 2023 | $13,373 | $502,760 | $247,600 | $255,160 |
| 2022 | $12,428 | $502,760 | $247,600 | $255,160 |
| 2021 | $14,250 | $502,760 | $247,600 | $255,160 |
| 2020 | $13,676 | $502,760 | $247,600 | $255,160 |
| 2019 | $15,992 | $475,000 | $200,640 | $274,360 |
| 2018 | $15,289 | $475,000 | $200,640 | $274,360 |
| 2017 | $15,289 | $475,000 | $200,640 | $274,360 |
| 2016 | $15,401 | $475,000 | $200,640 | $274,360 |
| 2015 | $15,757 | $475,000 | $200,640 | $274,360 |
| 2014 | $12,942 | $390,132 | $0 | $0 |
Source: Public Records
Map
Nearby Homes