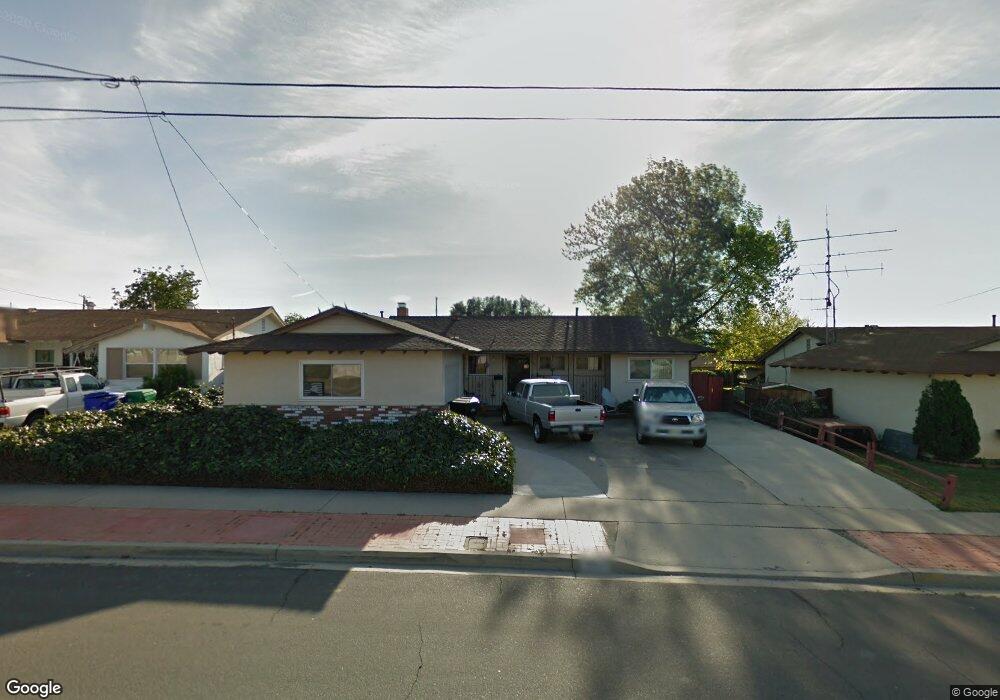
6351 Badger Lake Ave San Diego, CA 92119
Lake Murray NeighborhoodEstimated Value: $840,492 - $899,000
3
Beds
2
Baths
1,098
Sq Ft
$794/Sq Ft
Est. Value
About This Home
This home is located at 6351 Badger Lake Ave, San Diego, CA 92119 and is currently estimated at $871,873, approximately $794 per square foot. 6351 Badger Lake Ave is a home located in San Diego County with nearby schools including Benchley-Weinberger Elementary, Pershing Middle School, and Patrick Henry High School.
Ownership History
Date
Name
Owned For
Owner Type
Purchase Details
Closed on
May 5, 2014
Sold by
Backens Gregory A and Backens Jo Ann
Bought by
The Backens Revocable Trust and Backens Jo Ann
Current Estimated Value
Purchase Details
Closed on
May 31, 2013
Sold by
Cox Sharon F and Cox Lloyd Robert
Bought by
Backens Gregory A and Backens Jo Ann
Home Financials for this Owner
Home Financials are based on the most recent Mortgage that was taken out on this home.
Original Mortgage
$243,750
Outstanding Balance
$52,015
Interest Rate
2.58%
Mortgage Type
New Conventional
Estimated Equity
$819,858
Purchase Details
Closed on
Nov 19, 2012
Sold by
Cox Sharon F
Bought by
Cox Sharon F and Cox Lloyd Robert
Purchase Details
Closed on
Dec 14, 2004
Sold by
Chandler Richard J and Chandler Erdine M
Bought by
Chandler Richard J and Chandler Erdine M
Create a Home Valuation Report for This Property
The Home Valuation Report is an in-depth analysis detailing your home's value as well as a comparison with similar homes in the area
Home Values in the Area
Average Home Value in this Area
Purchase History
| Date | Buyer | Sale Price | Title Company |
|---|---|---|---|
| The Backens Revocable Trust | -- | None Available | |
| Backens Gregory A | $325,000 | Chicago Title Company | |
| Cox Sharon F | -- | None Available | |
| Cox Sharon F | -- | None Available | |
| Chandler Richard J | -- | -- |
Source: Public Records
Mortgage History
| Date | Status | Borrower | Loan Amount |
|---|---|---|---|
| Open | Backens Gregory A | $243,750 |
Source: Public Records
Tax History Compared to Growth
Tax History
| Year | Tax Paid | Tax Assessment Tax Assessment Total Assessment is a certain percentage of the fair market value that is determined by local assessors to be the total taxable value of land and additions on the property. | Land | Improvement |
|---|---|---|---|---|
| 2025 | $4,933 | $400,200 | $294,267 | $105,933 |
| 2024 | $4,933 | $392,354 | $288,498 | $103,856 |
| 2023 | $4,841 | $384,662 | $282,842 | $101,820 |
| 2022 | $4,713 | $377,121 | $277,297 | $99,824 |
| 2021 | $4,680 | $369,727 | $271,860 | $97,867 |
| 2020 | $4,624 | $365,937 | $269,073 | $96,864 |
| 2019 | $4,542 | $358,763 | $263,798 | $94,965 |
| 2018 | $4,247 | $351,729 | $258,626 | $93,103 |
| 2017 | $4,146 | $344,833 | $253,555 | $91,278 |
| 2016 | $4,079 | $338,073 | $248,584 | $89,489 |
| 2015 | $4,019 | $332,996 | $244,851 | $88,145 |
| 2014 | $3,945 | $326,474 | $240,055 | $86,419 |
Source: Public Records
Map
Nearby Homes
- 8364 Lake Ashwood Ave
- 6476 Jackson Dr
- 6224 Rose Lake Ave
- 6388 Anvil Lake Ave
- 6387 Anvil Lake Ave
- 8202 Beaver Lake Dr
- 7976 Lake Cayuga Dr
- 6252 Lake Albano Ave
- 8343 San Carlos Dr
- 6285 Anvil Lake Ave
- 6548 Bantam Lake Cir
- 7838 Cowles Mountain Ct Unit C6
- 7838 Cowles Mountain Ct Unit C32
- 7838 Cowles Mountain Ct Unit 18
- 7835 Cowles Mountain Ct Unit B6
- 8374 Lake Gaby Ave
- 7880 El Paso St
- 6354 Arms Lake Ave
- 8649 Lake Murray Blvd Unit 4
- 6371 Twin Lake Dr
- 6357 Badger Lake Ave
- 6345 Badger Lake Ave
- 6340 Budlong Lake Ave
- 6334 Budlong Lake Ave
- 6365 Badger Lake Ave
- 6346 Budlong Lake Ave
- 6339 Badger Lake Ave
- 6328 Budlong Lake Ave
- 6350 Badger Lake Ave
- 6358 Badger Lake Ave
- 6344 Badger Lake Ave
- 6373 Badger Lake Ave
- 6333 Badger Lake Ave
- 6366 Badger Lake Ave
- 6358 Budlong Lake Ave
- 6338 Badger Lake Ave
- 6322 Budlong Lake Ave
- 6374 Badger Lake Ave
- 6381 Badger Lake Ave
- 6337 Budlong Lake Ave