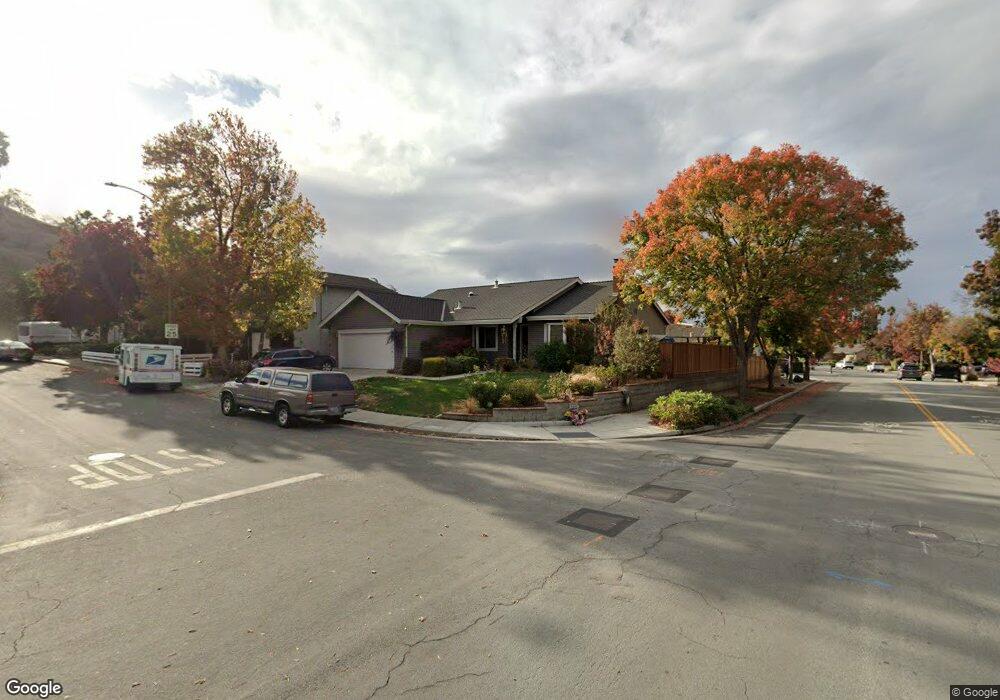
6351 Didion Way San Jose, CA 95123
Santa Teresa Foothills NeighborhoodEstimated Value: $1,506,000 - $1,634,000
4
Beds
2
Baths
1,826
Sq Ft
$869/Sq Ft
Est. Value
About This Home
This home is located at 6351 Didion Way, San Jose, CA 95123 and is currently estimated at $1,587,025, approximately $869 per square foot. 6351 Didion Way is a home located in Santa Clara County with nearby schools including Bertha Taylor Elementary School, Bernal Intermediate School, and Santa Teresa High School.
Ownership History
Date
Name
Owned For
Owner Type
Purchase Details
Closed on
Dec 21, 2020
Sold by
Sawyer Kenneth Larry and Sawyer Heroine Nancy
Bought by
Sawyer Kenneth L and Sawyer Nancy H
Current Estimated Value
Home Financials for this Owner
Home Financials are based on the most recent Mortgage that was taken out on this home.
Original Mortgage
$291,000
Outstanding Balance
$162,560
Interest Rate
2.71%
Mortgage Type
New Conventional
Estimated Equity
$1,424,465
Purchase Details
Closed on
Aug 10, 2020
Sold by
Sawyer Kenneth and Sawyer Nancy H
Bought by
Sawyer Family Trust and Sawyer
Purchase Details
Closed on
Apr 7, 1998
Sold by
Merkel Charles E and Merkel Patricia J
Bought by
Sawyer Kenneth L and Nancy Sawyer H
Home Financials for this Owner
Home Financials are based on the most recent Mortgage that was taken out on this home.
Original Mortgage
$272,000
Interest Rate
7.06%
Create a Home Valuation Report for This Property
The Home Valuation Report is an in-depth analysis detailing your home's value as well as a comparison with similar homes in the area
Home Values in the Area
Average Home Value in this Area
Purchase History
| Date | Buyer | Sale Price | Title Company |
|---|---|---|---|
| Sawyer Kenneth L | -- | Accommodation | |
| Sawyer Kenneth Larry | -- | Fidelity National Title | |
| Sawyer Family Trust | -- | Elting James | |
| Sawyer Kenneth L | $340,000 | First American Title Guarant |
Source: Public Records
Mortgage History
| Date | Status | Borrower | Loan Amount |
|---|---|---|---|
| Open | Sawyer Kenneth Larry | $291,000 | |
| Previous Owner | Sawyer Kenneth L | $272,000 | |
| Closed | Sawyer Kenneth L | $34,000 |
Source: Public Records
Tax History Compared to Growth
Tax History
| Year | Tax Paid | Tax Assessment Tax Assessment Total Assessment is a certain percentage of the fair market value that is determined by local assessors to be the total taxable value of land and additions on the property. | Land | Improvement |
|---|---|---|---|---|
| 2025 | $8,251 | $542,476 | $159,665 | $382,811 |
| 2024 | $8,251 | $531,840 | $156,535 | $375,305 |
| 2023 | $8,106 | $521,413 | $153,466 | $367,947 |
| 2022 | $8,044 | $511,190 | $150,457 | $360,733 |
| 2021 | $7,898 | $501,167 | $147,507 | $353,660 |
| 2020 | $7,620 | $496,029 | $145,995 | $350,034 |
| 2019 | $7,432 | $486,304 | $143,133 | $343,171 |
| 2018 | $7,368 | $476,770 | $140,327 | $336,443 |
| 2017 | $7,266 | $467,423 | $137,576 | $329,847 |
| 2016 | $6,917 | $458,259 | $134,879 | $323,380 |
| 2015 | $6,760 | $451,376 | $132,853 | $318,523 |
| 2014 | $6,051 | $442,535 | $130,251 | $312,284 |
Source: Public Records
Map
Nearby Homes