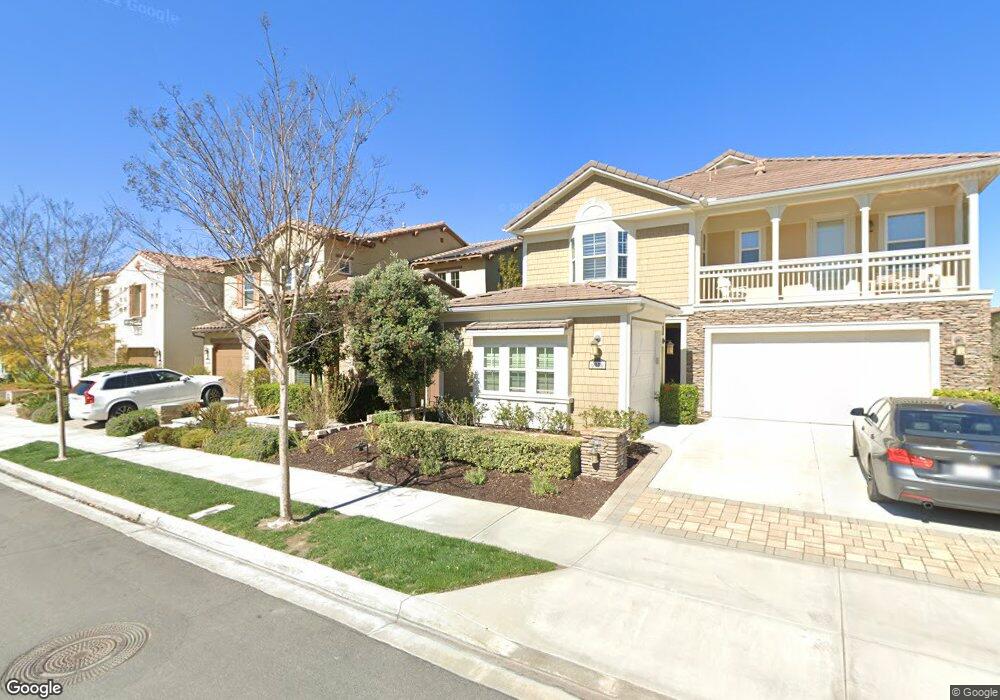
6352 Quail Run St San Diego, CA 92130
Carmel Valley NeighborhoodEstimated Value: $2,450,281 - $2,719,000
5
Beds
3
Baths
2,993
Sq Ft
$870/Sq Ft
Est. Value
About This Home
This home is located at 6352 Quail Run St, San Diego, CA 92130 and is currently estimated at $2,605,320, approximately $870 per square foot. 6352 Quail Run St is a home located in San Diego County with nearby schools including Solana Ranch Elementary School, Pacific Trails Middle, and Torrey Pines High School.
Ownership History
Date
Name
Owned For
Owner Type
Purchase Details
Closed on
Jun 29, 2021
Sold by
Cofini Louis and Cofini Martha
Bought by
Cofini Family Trust and Cofini
Current Estimated Value
Purchase Details
Closed on
Jun 8, 2018
Sold by
Chan Mark Chehung and Chan Hong Trieu
Bought by
Cofini Louis and Lamboy Cofini Martha
Home Financials for this Owner
Home Financials are based on the most recent Mortgage that was taken out on this home.
Original Mortgage
$1,096,000
Interest Rate
4.6%
Mortgage Type
New Conventional
Purchase Details
Closed on
Sep 13, 2012
Sold by
Pardee Homes
Bought by
Chun Mark Chehung and Chan Hung Trieu
Home Financials for this Owner
Home Financials are based on the most recent Mortgage that was taken out on this home.
Original Mortgage
$546,250
Interest Rate
3.59%
Mortgage Type
New Conventional
Create a Home Valuation Report for This Property
The Home Valuation Report is an in-depth analysis detailing your home's value as well as a comparison with similar homes in the area
Home Values in the Area
Average Home Value in this Area
Purchase History
| Date | Buyer | Sale Price | Title Company |
|---|---|---|---|
| Cofini Family Trust | -- | None Listed On Document | |
| Cofini Louis | $1,370,000 | Corinthian Title | |
| Chun Mark Chehung | $901,000 | Chicago Title Company |
Source: Public Records
Mortgage History
| Date | Status | Borrower | Loan Amount |
|---|---|---|---|
| Previous Owner | Cofini Louis | $1,096,000 | |
| Previous Owner | Chun Mark Chehung | $546,250 |
Source: Public Records
Tax History Compared to Growth
Tax History
| Year | Tax Paid | Tax Assessment Tax Assessment Total Assessment is a certain percentage of the fair market value that is determined by local assessors to be the total taxable value of land and additions on the property. | Land | Improvement |
|---|---|---|---|---|
| 2025 | $21,614 | $1,558,821 | $910,261 | $648,560 |
| 2024 | $21,614 | $1,528,257 | $892,413 | $635,844 |
| 2023 | $21,249 | $1,498,292 | $874,915 | $623,377 |
| 2022 | $20,976 | $1,468,914 | $857,760 | $611,154 |
| 2021 | $20,683 | $1,440,113 | $840,942 | $599,171 |
| 2020 | $20,544 | $1,425,348 | $832,320 | $593,028 |
| 2019 | $20,240 | $1,397,400 | $816,000 | $581,400 |
| 2018 | $15,878 | $980,092 | $541,129 | $438,963 |
| 2017 | $15,788 | $960,875 | $530,519 | $430,356 |
| 2016 | $15,458 | $942,035 | $520,117 | $421,918 |
| 2015 | $15,327 | $927,886 | $512,305 | $415,581 |
| 2014 | $15,155 | $909,711 | $502,270 | $407,441 |
Source: Public Records
Map
Nearby Homes
- 13563 Chamise Vista Ln
- 6336 Sagebrush Bend Way
- 6265 Silverbush Creek St
- 13441 Banyan Way
- 6222 Artisan Way
- 13568 Bolero Way
- 13348 Camelia Way
- 6744 Monterra Trail
- 13032 Alora Point Unit 170
- 13016 Lumen Way
- 12932 Peppergrass Creek Gate Unit 58
- 14619 Calle Carla
- 13033 Lamia Point Unit 217
- 13233 Petunia Way
- 7001 Via Agave
- 7066 Via Agave
- 14786 Rancho Santa Fe Farms Rd
- 13165 Caminito Mendiola
- 5347 Morning Sage Way
- 5621 Shasta Daisy Trail
- 6356 Quail Run St
- 6348 Quail Run St
- 6360 Quail Run St
- 6344 Quail Run St
- 6364 Quail Run St
- 6340 Quail Run St
- 6351 Quail Run St
- 6347 Quail Run St
- 6357 Quail Run St
- 6343 Quail Run St
- 6361 Quail Run St
- 6368 Quail Run St
- 6336 Quail Run St
- 6341 Quail Run St
- 6365 Quail Run St
- 6372 Quail Run St
- 6332 Quail Run St
- 6369 Quail Run St
- 6333 Quail Run St
- 6348 Montez Villa Rd