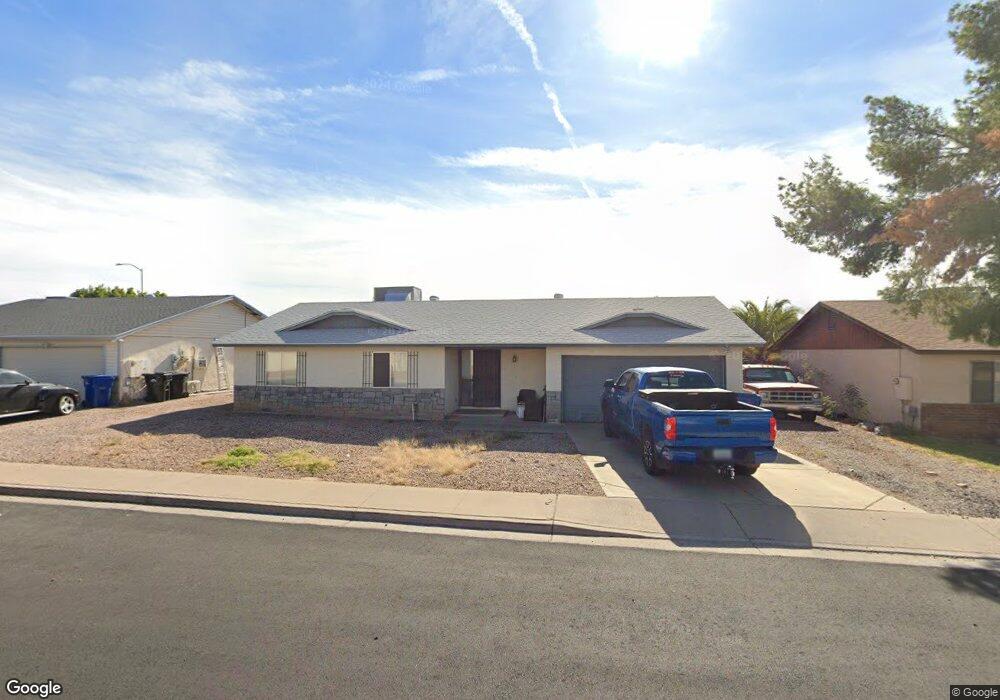
6353 E Ivyglen St Mesa, AZ 85205
Central Mesa East NeighborhoodEstimated Value: $396,635 - $475,000
Studio
2
Baths
1,774
Sq Ft
$254/Sq Ft
Est. Value
About This Home
This home is located at 6353 E Ivyglen St, Mesa, AZ 85205 and is currently estimated at $451,409, approximately $254 per square foot. 6353 E Ivyglen St is a home located in Maricopa County with nearby schools including Mendoza Elementary School, Franklin at Brimhall Elementary School, and Franklin West Elementary School.
Ownership History
Date
Name
Owned For
Owner Type
Purchase Details
Closed on
Jan 10, 2006
Sold by
Voirin Linda A
Bought by
Voirin Steven M
Current Estimated Value
Home Financials for this Owner
Home Financials are based on the most recent Mortgage that was taken out on this home.
Original Mortgage
$173,000
Outstanding Balance
$97,124
Interest Rate
6.25%
Mortgage Type
Fannie Mae Freddie Mac
Estimated Equity
$354,285
Purchase Details
Closed on
Jun 2, 2004
Sold by
Voirin Steven M and Love Linda A
Bought by
Voirin Steven M and Voirin Linda A
Home Financials for this Owner
Home Financials are based on the most recent Mortgage that was taken out on this home.
Original Mortgage
$125,600
Interest Rate
5.92%
Mortgage Type
New Conventional
Create a Home Valuation Report for This Property
The Home Valuation Report is an in-depth analysis detailing your home's value as well as a comparison with similar homes in the area
Home Values in the Area
Average Home Value in this Area
Purchase History
| Date | Buyer | Sale Price | Title Company |
|---|---|---|---|
| Voirin Steven M | -- | Lawyers Title Ins | |
| Voirin Steven M | -- | First American Title Ins Co |
Source: Public Records
Mortgage History
| Date | Status | Borrower | Loan Amount |
|---|---|---|---|
| Open | Voirin Steven M | $173,000 | |
| Closed | Voirin Steven M | $125,600 |
Source: Public Records
Tax History
| Year | Tax Paid | Tax Assessment Tax Assessment Total Assessment is a certain percentage of the fair market value that is determined by local assessors to be the total taxable value of land and additions on the property. | Land | Improvement |
|---|---|---|---|---|
| 2025 | $1,469 | $17,685 | -- | -- |
| 2024 | $1,485 | $16,843 | -- | -- |
| 2023 | $1,485 | $33,460 | $6,690 | $26,770 |
| 2022 | $1,452 | $25,470 | $5,090 | $20,380 |
| 2021 | $1,492 | $22,630 | $4,520 | $18,110 |
| 2020 | $1,472 | $20,560 | $4,110 | $16,450 |
| 2019 | $1,364 | $19,060 | $3,810 | $15,250 |
| 2018 | $1,302 | $16,920 | $3,380 | $13,540 |
| 2017 | $1,261 | $16,030 | $3,200 | $12,830 |
| 2016 | $1,238 | $15,230 | $3,040 | $12,190 |
| 2015 | $1,169 | $14,550 | $2,910 | $11,640 |
Source: Public Records
Map
Nearby Homes
- 6539 E Ingram St
- 1461 N 63rd Place
- 6223 E Hannibal St
- 6209 E Mckellips Rd Unit 128
- 6209 E Mckellips Rd Unit 306
- 6209 E Mckellips Rd Unit 330
- 6209 E Mckellips Rd Unit 235
- 6209 E Mckellips Rd Unit 292
- 6209 E Mckellips Rd Unit 325
- 6209 E Mckellips Rd Unit 421
- 6209 E Mckellips Rd Unit 249
- 6209 E Mckellips Rd Unit 434
- 6209 E Mckellips Rd Unit 145
- 6209 E Mckellips Rd Unit 429
- 6209 E Mckellips Rd Unit 441
- 6209 E Mckellips Rd Unit 219
- 6209 E Mckellips Rd Unit 460
- 6209 E Mckellips Rd Unit 56
- 6209 E Mckellips Rd Unit 55
- 6209 E Mckellips Rd Unit 9
- 6345 E Ivyglen St
- 6361 E Ivyglen St
- 6354 E Ivy St
- 6344 E Ivy St
- 6360 E Ivy St
- 6337 E Ivyglen St
- 1709 N Sea Pines
- 1712 N 64th St
- 6338 E Ivy St
- 6329 E Ivyglen St
- 1716 N Sea Pines
- 1721 N Sea Pines
- 6326 E Ivy St
- 1730 N 64th St
- 1715 N 64th St
- 1703 N 64th St
- 6405 E Ingram St
- 6357 E Ivy St
- 6363 E Ivy St
- 6323 E Ivyglen St
Your Personal Tour Guide
Ask me questions while you tour the home.