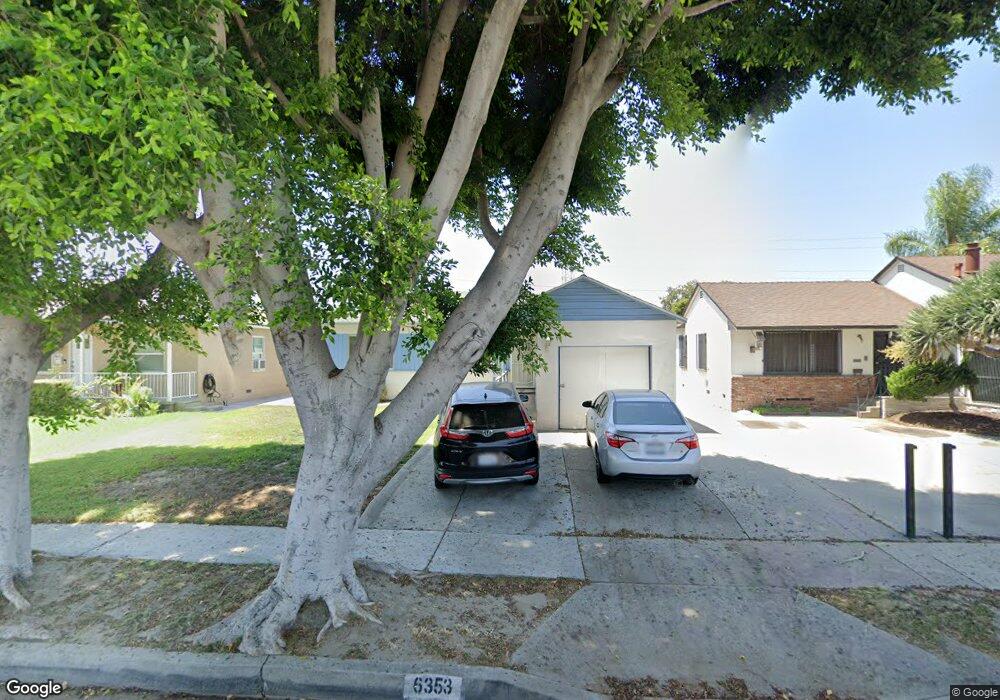
6353 Paramount Blvd Pico Rivera, CA 90660
Estimated Value: $652,939 - $738,000
2
Beds
1
Bath
921
Sq Ft
$760/Sq Ft
Est. Value
About This Home
This home is located at 6353 Paramount Blvd, Pico Rivera, CA 90660 and is currently estimated at $699,735, approximately $759 per square foot. 6353 Paramount Blvd is a home located in Los Angeles County with nearby schools including Rio Vista Elementary School, Ruben Salazar Continuation School, and El Rancho High School.
Ownership History
Date
Name
Owned For
Owner Type
Purchase Details
Closed on
Jul 17, 1999
Sold by
Hud
Bought by
Herrera Patricia
Current Estimated Value
Home Financials for this Owner
Home Financials are based on the most recent Mortgage that was taken out on this home.
Original Mortgage
$92,000
Outstanding Balance
$25,913
Interest Rate
7.63%
Estimated Equity
$673,822
Purchase Details
Closed on
Apr 16, 1999
Sold by
Norwest Mtg Inc
Bought by
Hud
Purchase Details
Closed on
Nov 6, 1998
Sold by
Rivas Rafael and Rivas Micaela
Bought by
Norwest Mtg Inc
Purchase Details
Closed on
Nov 27, 1995
Sold by
Heasley Edith V
Bought by
Heasley Edith and Edith V Heasley Trust
Purchase Details
Closed on
Apr 10, 1995
Sold by
Heasley Edith V
Bought by
Rivas Rafael
Home Financials for this Owner
Home Financials are based on the most recent Mortgage that was taken out on this home.
Original Mortgage
$118,405
Interest Rate
8.47%
Mortgage Type
FHA
Create a Home Valuation Report for This Property
The Home Valuation Report is an in-depth analysis detailing your home's value as well as a comparison with similar homes in the area
Home Values in the Area
Average Home Value in this Area
Purchase History
| Date | Buyer | Sale Price | Title Company |
|---|---|---|---|
| Herrera Patricia | $115,000 | Provident Title Company | |
| Hud | -- | Fidelity National Title Ins | |
| Norwest Mtg Inc | $124,704 | Fidelity National Title Ins | |
| Heasley Edith | -- | -- | |
| Rivas Rafael | $119,000 | First American Title Company |
Source: Public Records
Mortgage History
| Date | Status | Borrower | Loan Amount |
|---|---|---|---|
| Open | Herrera Patricia | $92,000 | |
| Previous Owner | Rivas Rafael | $118,405 |
Source: Public Records
Tax History
| Year | Tax Paid | Tax Assessment Tax Assessment Total Assessment is a certain percentage of the fair market value that is determined by local assessors to be the total taxable value of land and additions on the property. | Land | Improvement |
|---|---|---|---|---|
| 2025 | $6,527 | $176,726 | $145,999 | $30,727 |
| 2024 | $6,527 | $173,262 | $143,137 | $30,125 |
| 2023 | $6,447 | $169,866 | $140,331 | $29,535 |
| 2022 | $6,321 | $166,536 | $137,580 | $28,956 |
| 2021 | $6,223 | $163,272 | $134,883 | $28,389 |
| 2019 | $6,193 | $158,431 | $130,883 | $27,548 |
| 2018 | $6,007 | $155,325 | $128,317 | $27,008 |
| 2016 | $5,782 | $149,295 | $123,335 | $25,960 |
| 2015 | $2,178 | $147,054 | $121,483 | $25,571 |
| 2014 | $2,156 | $144,175 | $119,104 | $25,071 |
Source: Public Records
Map
Nearby Homes
- 6449 Triton Dr
- 6722 Keltonview Dr
- 9243 Balfour St
- 5259 Calico Ave
- 5313 Manzanar Ave
- 6651 Via Vista
- 6650 Via Vista
- 6630 Via Vista
- 6648 Via Vista
- 405 S Bluff Rd
- 9324 Rosehedge Dr
- 649 S 5th St
- 524 Washington Blvd
- 9203 Loch Lomond Dr
- 915 Carob Way Unit 3
- 7019 Passons Blvd
- 7021 Passons Blvd
- 932 S Montebello Blvd
- 9603 Homebrook St
- 9514 Bradhurst St
- 6347 Paramount Blvd
- 6357 Paramount Blvd
- 6343 Paramount Blvd
- 6363 Paramount Blvd
- 6337 Paramount Blvd
- 6403 Paramount Blvd
- 4101 110 Paramount Blvd Unit sp 110
- 6404 Silverette Dr
- 6376 Silverette Dr
- 6412 Silverette Dr
- 6352 Paramount Blvd
- 6420 Silverette Dr
- 6348 Paramount Blvd
- 6358 Paramount Blvd
- 6366 Silverette Dr
- 6333 Paramount Blvd
- 6342 Paramount Blvd
- 6362 Paramount Blvd
- 6409 Paramount Blvd
- 6360 Silverette Dr
Your Personal Tour Guide
Ask me questions while you tour the home.