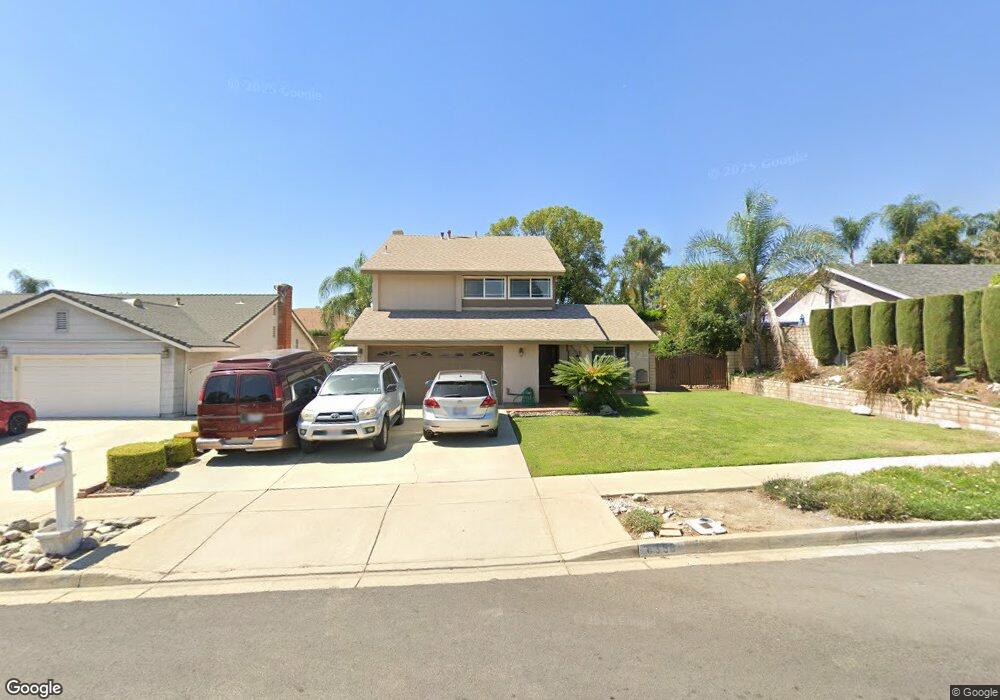
6356 Kinlock St Rancho Cucamonga, CA 91737
Alta Loma NeighborhoodEstimated Value: $726,001 - $1,111,000
4
Beds
3
Baths
1,837
Sq Ft
$475/Sq Ft
Est. Value
About This Home
This home is located at 6356 Kinlock St, Rancho Cucamonga, CA 91737 and is currently estimated at $872,500, approximately $474 per square foot. 6356 Kinlock St is a home located in San Bernardino County with nearby schools including Deer Canyon Elementary, Vineyard Junior High, and Los Osos High.
Ownership History
Date
Name
Owned For
Owner Type
Purchase Details
Closed on
Jun 18, 2018
Sold by
Codling Francisco
Bought by
Codling Francisco D and Meza Patricia
Current Estimated Value
Home Financials for this Owner
Home Financials are based on the most recent Mortgage that was taken out on this home.
Original Mortgage
$406,000
Outstanding Balance
$351,122
Interest Rate
4.5%
Mortgage Type
New Conventional
Estimated Equity
$521,378
Purchase Details
Closed on
Dec 12, 2001
Sold by
Mattke Eric
Bought by
Codling Francisco and Meza Patricia
Home Financials for this Owner
Home Financials are based on the most recent Mortgage that was taken out on this home.
Original Mortgage
$213,000
Interest Rate
7.17%
Purchase Details
Closed on
Mar 29, 1996
Sold by
Mann Morris E
Bought by
Mattke Eric and Mattke Rebecca
Home Financials for this Owner
Home Financials are based on the most recent Mortgage that was taken out on this home.
Original Mortgage
$145,132
Interest Rate
7.41%
Mortgage Type
FHA
Create a Home Valuation Report for This Property
The Home Valuation Report is an in-depth analysis detailing your home's value as well as a comparison with similar homes in the area
Home Values in the Area
Average Home Value in this Area
Purchase History
| Date | Buyer | Sale Price | Title Company |
|---|---|---|---|
| Codling Francisco D | -- | Lawyers Title Company | |
| Codling Francisco | $236,000 | Stewart Title | |
| Mattke Eric | $148,000 | Orange Coast Title |
Source: Public Records
Mortgage History
| Date | Status | Borrower | Loan Amount |
|---|---|---|---|
| Open | Codling Francisco D | $406,000 | |
| Previous Owner | Codling Francisco | $213,000 | |
| Previous Owner | Mattke Eric | $145,132 |
Source: Public Records
Tax History
| Year | Tax Paid | Tax Assessment Tax Assessment Total Assessment is a certain percentage of the fair market value that is determined by local assessors to be the total taxable value of land and additions on the property. | Land | Improvement |
|---|---|---|---|---|
| 2025 | $3,760 | $336,824 | $84,206 | $252,618 |
| 2024 | $3,666 | $330,220 | $82,555 | $247,665 |
| 2023 | $3,584 | $323,745 | $80,936 | $242,809 |
| 2022 | $3,575 | $317,397 | $79,349 | $238,048 |
| 2021 | $3,573 | $311,173 | $77,793 | $233,380 |
| 2020 | $3,427 | $307,982 | $76,995 | $230,987 |
| 2019 | $3,466 | $301,943 | $75,485 | $226,458 |
| 2018 | $3,389 | $296,023 | $74,005 | $222,018 |
| 2017 | $3,235 | $290,219 | $72,554 | $217,665 |
| 2016 | $3,147 | $284,528 | $71,131 | $213,397 |
| 2015 | $3,128 | $280,255 | $70,063 | $210,192 |
| 2014 | $3,039 | $274,766 | $68,691 | $206,075 |
Source: Public Records
Map
Nearby Homes
- 6270 Kinlock Ave
- 10480 Alta Loma Dr
- 6600 Montresor Place
- 10211 Corkwood Ct
- 10332 Southridge Dr
- 6433 Aleatico Place
- 10655 Lemon Ave
- 10655 Lemon Ave Unit 3704
- 10655 Lemon Ave Unit 1001
- 10655 Lemon Ave Unit 4009
- 9805 Liberty St
- 10456 Hamilton St
- 6770 Berkshire Ave
- 6471 Caledon Place
- 6105 Sherry Ct
- 9737 Liberty Ct
- 9735 Liberty Ct
- 10154 Northridge Dr
- 10302 Northridge Dr
- 6587 Shawna Ave
- 6344 Kinlock St
- 6366 Kinlock St
- 6355 Malvern St
- 6367 Malvern St
- 6345 Malvern St
- 6334 Kinlock St
- 6357 Kinlock St
- 6345 Kinlock St
- 6367 Kinlock St
- 6333 Malvern St
- 6335 Kinlock St
- 10207 Bristol Dr
- 6324 Kinlock St
- 10217 Bristol Dr
- 10199 Bristol Dr
- 6321 Malvern St
- 10168 Bristol Dr
- 10227 Bristol Dr
- 10191 Bristol Dr
- 10169 Orange St
Your Personal Tour Guide
Ask me questions while you tour the home.