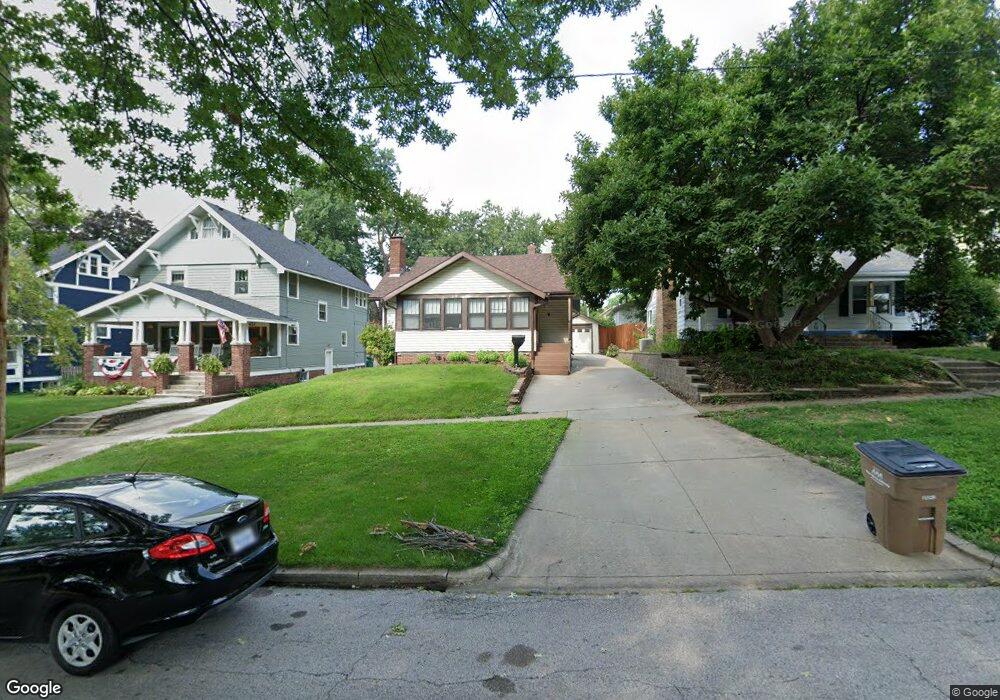
636 5th St West Des Moines, IA 50265
Estimated Value: $216,000 - $258,000
2
Beds
1
Bath
1,107
Sq Ft
$211/Sq Ft
Est. Value
About This Home
This home is located at 636 5th St, West Des Moines, IA 50265 and is currently estimated at $233,728, approximately $211 per square foot. 636 5th St is a home located in Polk County with nearby schools including Hillside Elementary School, Stilwell Junior High School, and Valley Southwoods Freshman High School.
Ownership History
Date
Name
Owned For
Owner Type
Purchase Details
Closed on
Jun 17, 2015
Sold by
Landman Brenda K
Bought by
Tedder Lawrence E and Raker Amy B
Current Estimated Value
Home Financials for this Owner
Home Financials are based on the most recent Mortgage that was taken out on this home.
Original Mortgage
$99,360
Outstanding Balance
$77,149
Interest Rate
3.82%
Mortgage Type
New Conventional
Estimated Equity
$156,579
Purchase Details
Closed on
Jul 28, 2003
Sold by
Landman Ronald J
Bought by
Landman Brenda K
Purchase Details
Closed on
Jan 13, 2002
Sold by
Letze Larry M and Letze Julie E
Bought by
Landman Brenda K and Gould Joyce A
Home Financials for this Owner
Home Financials are based on the most recent Mortgage that was taken out on this home.
Original Mortgage
$99,045
Interest Rate
6.92%
Mortgage Type
FHA
Create a Home Valuation Report for This Property
The Home Valuation Report is an in-depth analysis detailing your home's value as well as a comparison with similar homes in the area
Home Values in the Area
Average Home Value in this Area
Purchase History
| Date | Buyer | Sale Price | Title Company |
|---|---|---|---|
| Tedder Lawrence E | $135,000 | None Available | |
| Landman Brenda K | -- | -- | |
| Landman Brenda K | $100,500 | -- |
Source: Public Records
Mortgage History
| Date | Status | Borrower | Loan Amount |
|---|---|---|---|
| Open | Tedder Lawrence E | $99,360 | |
| Previous Owner | Landman Brenda K | $99,045 |
Source: Public Records
Tax History Compared to Growth
Tax History
| Year | Tax Paid | Tax Assessment Tax Assessment Total Assessment is a certain percentage of the fair market value that is determined by local assessors to be the total taxable value of land and additions on the property. | Land | Improvement |
|---|---|---|---|---|
| 2025 | $3,002 | $219,200 | $62,300 | $156,900 |
| 2024 | $3,002 | $199,900 | $56,700 | $143,200 |
| 2023 | $3,032 | $199,900 | $56,700 | $143,200 |
| 2022 | $2,994 | $165,900 | $48,900 | $117,000 |
| 2021 | $2,836 | $165,900 | $48,900 | $117,000 |
| 2020 | $2,788 | $150,000 | $44,500 | $105,500 |
| 2019 | $2,570 | $150,000 | $44,500 | $105,500 |
| 2018 | $2,752 | $134,000 | $39,000 | $95,000 |
| 2017 | $2,636 | $134,000 | $39,000 | $95,000 |
| 2016 | $2,578 | $124,700 | $35,800 | $88,900 |
| 2015 | $2,578 | $124,700 | $35,800 | $88,900 |
| 2014 | $2,484 | $127,500 | $35,900 | $91,600 |
Source: Public Records
Map
Nearby Homes