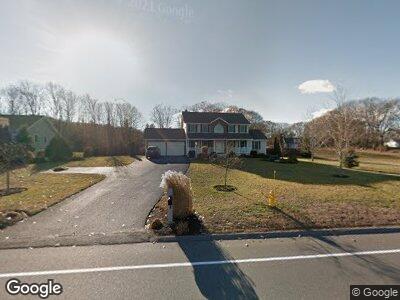
636 Baldwinville Rd Baldwinville, MA 01436
Baldwinville NeighborhoodEstimated Value: $485,000 - $519,000
3
Beds
3
Baths
2,312
Sq Ft
$217/Sq Ft
Est. Value
About This Home
This home is located at 636 Baldwinville Rd, Baldwinville, MA 01436 and is currently estimated at $500,672, approximately $216 per square foot. 636 Baldwinville Rd is a home located in Worcester County with nearby schools including Narragansett Regional High School.
Ownership History
Date
Name
Owned For
Owner Type
Purchase Details
Closed on
Apr 12, 2018
Sold by
Faul David D
Bought by
Sanchez Daniel and Bangrazi-Sanchez Alicia
Current Estimated Value
Home Financials for this Owner
Home Financials are based on the most recent Mortgage that was taken out on this home.
Original Mortgage
$287,173
Interest Rate
4.43%
Mortgage Type
VA
Purchase Details
Closed on
Jun 2, 2017
Sold by
Molina Jose and Molina Sarah
Bought by
Bangrazi-Sanchez Alicia and Sanchez Daniel
Home Financials for this Owner
Home Financials are based on the most recent Mortgage that was taken out on this home.
Original Mortgage
$250,800
Interest Rate
3.97%
Mortgage Type
New Conventional
Purchase Details
Closed on
Nov 3, 2006
Sold by
Matson Homes Inc
Bought by
Molina Jose
Home Financials for this Owner
Home Financials are based on the most recent Mortgage that was taken out on this home.
Original Mortgage
$260,888
Interest Rate
6.47%
Mortgage Type
Purchase Money Mortgage
Create a Home Valuation Report for This Property
The Home Valuation Report is an in-depth analysis detailing your home's value as well as a comparison with similar homes in the area
Home Values in the Area
Average Home Value in this Area
Purchase History
| Date | Buyer | Sale Price | Title Company |
|---|---|---|---|
| Sanchez Daniel | -- | -- | |
| Bangrazi-Sanchez Alicia | $264,000 | -- | |
| Molina Jose | $326,110 | -- |
Source: Public Records
Mortgage History
| Date | Status | Borrower | Loan Amount |
|---|---|---|---|
| Open | Sanchez Daniel | $117,000 | |
| Open | Sanchez Daniel | $353,000 | |
| Closed | Sanchez Daniel | $287,173 | |
| Previous Owner | Bangrazi-Sanchez Alicia | $250,800 | |
| Previous Owner | Molina Jose | $241,800 | |
| Previous Owner | Molina Jose | $260,888 | |
| Previous Owner | Molina Jose | $48,916 |
Source: Public Records
Tax History Compared to Growth
Tax History
| Year | Tax Paid | Tax Assessment Tax Assessment Total Assessment is a certain percentage of the fair market value that is determined by local assessors to be the total taxable value of land and additions on the property. | Land | Improvement |
|---|---|---|---|---|
| 2025 | $5,496 | $453,500 | $61,600 | $391,900 |
| 2024 | $5,607 | $445,000 | $54,600 | $390,400 |
| 2023 | $5,185 | $401,300 | $54,600 | $346,700 |
| 2022 | $5,137 | $337,100 | $38,900 | $298,200 |
| 2021 | $5,041 | $312,900 | $38,900 | $274,000 |
| 2020 | $5,062 | $300,800 | $38,900 | $261,900 |
| 2018 | $4,407 | $263,600 | $35,500 | $228,100 |
| 2017 | $4,169 | $258,600 | $35,500 | $223,100 |
| 2016 | $3,930 | $238,600 | $35,500 | $203,100 |
| 2015 | $4,138 | $248,700 | $36,600 | $212,100 |
| 2014 | $3,912 | $240,900 | $36,600 | $204,300 |
Source: Public Records
Map
Nearby Homes
- 2 Fern St
- 33 Prospect St
- Bundle Mill St
- Lot 63 Mill St
- Lot 67 Mill St
- Lot 64 Mill St
- 3 Lots Mill St
- 132 Michael's Ln
- 22 Columbus Ave
- 15 Columbus Ave
- 19 Bridge St
- Lot 2 S Royalston Rd
- 58 N Main St
- 20 Baptist Common Rd
- 0 Hamlet Mill Rd Unit 72816399
- 301 Baldwinville Rd
- 137 Eli Dr
- 0 Mill St Unit 5033403
- 0 Mill St Unit 5007531
- 0 Mill St Unit 4996202
- 636 Baldwinville Rd
- 630 Baldwinville Rd
- 642 Baldwinville Rd
- 624 Baldwinville Rd
- 645 Baldwinville Rd
- 645 Baldwinville Rd
- 642 Baldwinville Rd
- 649 Baldwinville Rd
- 1 Lamont St
- 618 Baldwinville Rd
- 12 Mountain View St
- 18 Mountain View St
- 18 Mountain View St
- 617 Baldwinville Rd
- 611 Baldwinville Rd
- 658 Baldwinville Rd
- 658 Baldwinville Rd
- 20 Mountain View St
- 22 Lily Ln
- 15 Lily Ln