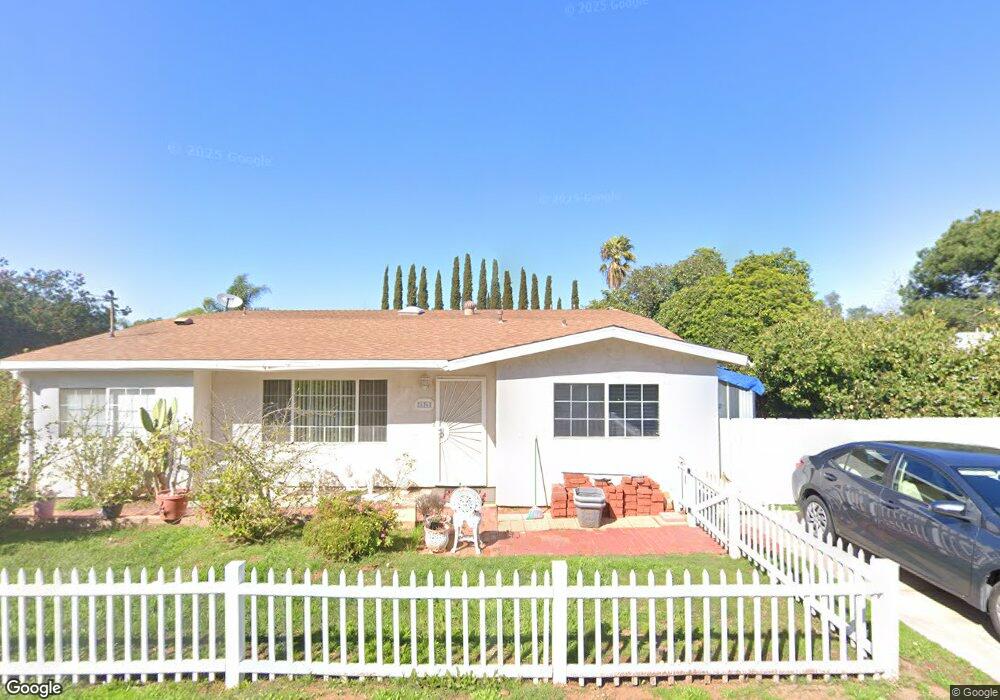
636 Howe Place Escondido, CA 92025
Kit Carson NeighborhoodEstimated Value: $819,959 - $941,000
4
Beds
3
Baths
1,828
Sq Ft
$490/Sq Ft
Est. Value
About This Home
This home is located at 636 Howe Place, Escondido, CA 92025 and is currently estimated at $895,990, approximately $490 per square foot. 636 Howe Place is a home located in San Diego County with nearby schools including Miller Elementary School, Del Dios Academy of Arts & Sciences, and San Pasqual High School.
Ownership History
Date
Name
Owned For
Owner Type
Purchase Details
Closed on
Apr 7, 1999
Sold by
Parra Gloria E
Bought by
Parra Gloria E and Parra Martin E
Current Estimated Value
Home Financials for this Owner
Home Financials are based on the most recent Mortgage that was taken out on this home.
Original Mortgage
$60,000
Outstanding Balance
$15,193
Interest Rate
7.04%
Estimated Equity
$880,797
Purchase Details
Closed on
Apr 18, 1998
Sold by
Heinselman Gloria M and Parra Gloria E
Bought by
Parra Gloria E and Parra Martin E
Purchase Details
Closed on
Apr 16, 1998
Sold by
Parra Martin E
Bought by
Parra Gloria E and Parra Martin E
Purchase Details
Closed on
Dec 31, 1996
Sold by
Heinselman Layman O
Bought by
Heinselman Gloria M and Parra Gloria E
Purchase Details
Closed on
Jul 19, 1994
Sold by
Heinselman Layman O and Heinselman Gloria M
Bought by
Heinselman Layman O and Heinselman Gloria M
Create a Home Valuation Report for This Property
The Home Valuation Report is an in-depth analysis detailing your home's value as well as a comparison with similar homes in the area
Home Values in the Area
Average Home Value in this Area
Purchase History
| Date | Buyer | Sale Price | Title Company |
|---|---|---|---|
| Parra Gloria E | -- | Chicago Title Co | |
| Parra Gloria E | -- | Chicago Title Co | |
| Parra Gloria E | -- | -- | |
| Parra Gloria E | -- | -- | |
| Heinselman Gloria M | -- | -- | |
| Heinselman Layman O | -- | -- |
Source: Public Records
Mortgage History
| Date | Status | Borrower | Loan Amount |
|---|---|---|---|
| Open | Parra Gloria E | $60,000 |
Source: Public Records
Tax History
| Year | Tax Paid | Tax Assessment Tax Assessment Total Assessment is a certain percentage of the fair market value that is determined by local assessors to be the total taxable value of land and additions on the property. | Land | Improvement |
|---|---|---|---|---|
| 2025 | $1,223 | $113,563 | $20,764 | $92,799 |
| 2024 | $1,223 | $111,337 | $20,357 | $90,980 |
| 2023 | $1,193 | $109,155 | $19,958 | $89,197 |
| 2022 | $1,179 | $107,016 | $19,567 | $87,449 |
| 2021 | $1,159 | $104,919 | $19,184 | $85,735 |
| 2020 | $1,151 | $103,844 | $18,988 | $84,856 |
| 2019 | $1,123 | $101,809 | $18,616 | $83,193 |
| 2018 | $1,090 | $99,813 | $18,251 | $81,562 |
| 2017 | $1,071 | $97,857 | $17,894 | $79,963 |
| 2016 | $1,048 | $95,940 | $17,544 | $78,396 |
| 2015 | $1,038 | $94,500 | $17,281 | $77,219 |
| 2014 | $995 | $92,650 | $16,943 | $75,707 |
Source: Public Records
Map
Nearby Homes
- 468 Carina Glen
- 2328 Columba Glen
- 2323 Stardust Glen
- 419 Atlas Glen
- 2328 Stardust Glen
- 1978 Arbor Glen
- 2217 Brix Glen
- 2339 Red Coral Glen
- 2341 Red Coral Glen
- 2343 Red Coral Glen
- 2338 Red Coral Glen
- 2340 Red Coral Glen
- 2342 Red Coral Glen
- 2344 Red Coral Glen
- 1860 S Escondido Blvd
- 2425 Cranston Dr Unit 227
- 2425 Cranston Dr Unit 219
- 2425 Cranston Dr Unit 39
- 2345 Miller Ave
- 1800 S Maple St Unit 102
- 644 Howe Place
- 628 Howe Place
- 1949 Vermont Place
- 635 Howe Place
- 652 Howe Place
- 1943 Vermont Place
- 620 Howe Place
- 1955 Vermont Place
- 1961 Vermont Place
- 656 Howe Place
- 1937 Vermont Place
- 655 Howe Place
- 1951 Rachelle Place
- 1961 Rachelle Place
- 1945 Alexander Dr
- 1941 Alexander Dr
- 1950 Vermont Place
- 1962 Rachelle Place
- 1967 Vermont Place
- 1937 Alexander Dr
Your Personal Tour Guide
Ask me questions while you tour the home.