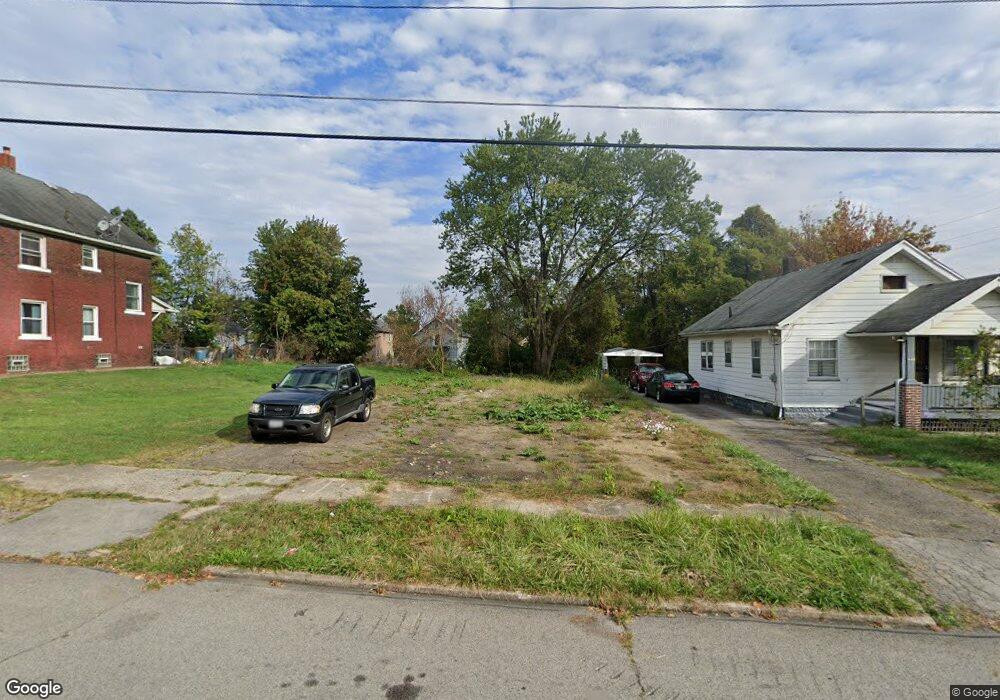
636 Lee Ave Unit 638 Youngstown, OH 44502
Lower Gibson NeighborhoodEstimated Value: $52,647 - $159,000
4
Beds
2
Baths
2,112
Sq Ft
$50/Sq Ft
Est. Value
About This Home
This home is located at 636 Lee Ave Unit 638, Youngstown, OH 44502 and is currently estimated at $105,824, approximately $50 per square foot. 636 Lee Ave Unit 638 is a home located in Mahoning County with nearby schools including Taft Elementary School, East High School, and South Side Academy.
Ownership History
Date
Name
Owned For
Owner Type
Purchase Details
Closed on
Sep 18, 2002
Sold by
Rapheal Richard and Boyd Steven
Bought by
Clos John
Current Estimated Value
Purchase Details
Closed on
Aug 23, 2002
Sold by
Lockhart Dewayne
Bought by
Rapheal Richard
Purchase Details
Closed on
Jun 8, 2002
Sold by
Family Investment Properties Llc
Bought by
Lockhart Dewayne
Purchase Details
Closed on
May 16, 2002
Sold by
Gary M Crim Inc
Bought by
Family Investment Properties Llc
Purchase Details
Closed on
Oct 11, 1994
Sold by
Frazzin C L
Bought by
P & M Investments Realty Inc
Home Financials for this Owner
Home Financials are based on the most recent Mortgage that was taken out on this home.
Original Mortgage
$1,418,930
Interest Rate
8.64%
Mortgage Type
New Conventional
Purchase Details
Closed on
Nov 19, 1987
Bought by
C L Frazzin Corp
Create a Home Valuation Report for This Property
The Home Valuation Report is an in-depth analysis detailing your home's value as well as a comparison with similar homes in the area
Home Values in the Area
Average Home Value in this Area
Purchase History
| Date | Buyer | Sale Price | Title Company |
|---|---|---|---|
| Clos John | -- | -- | |
| Rapheal Richard | -- | -- | |
| Lockhart Dewayne | $25,000 | -- | |
| Family Investment Properties Llc | $14,500 | -- | |
| P & M Investments Realty Inc | $1,096,130 | -- | |
| C L Frazzin Corp | $11,000 | -- |
Source: Public Records
Mortgage History
| Date | Status | Borrower | Loan Amount |
|---|---|---|---|
| Previous Owner | P & M Investments Realty Inc | $1,418,930 |
Source: Public Records
Tax History Compared to Growth
Tax History
| Year | Tax Paid | Tax Assessment Tax Assessment Total Assessment is a certain percentage of the fair market value that is determined by local assessors to be the total taxable value of land and additions on the property. | Land | Improvement |
|---|---|---|---|---|
| 2024 | $3 | $60 | $60 | -- |
| 2023 | $3 | $60 | $60 | $0 |
| 2022 | $4 | $60 | $60 | $0 |
| 2021 | $4 | $60 | $60 | $0 |
| 2020 | $4 | $60 | $60 | $0 |
| 2019 | $15,456 | $60 | $60 | $0 |
| 2018 | $52 | $550 | $60 | $490 |
| 2017 | $42 | $550 | $60 | $490 |
| 2016 | $37 | $510 | $60 | $450 |
| 2015 | $38 | $510 | $60 | $450 |
| 2014 | $36 | $510 | $60 | $450 |
| 2013 | $35 | $510 | $60 | $450 |
Source: Public Records
Map
Nearby Homes
- 702 Dickson St
- 708 Dickson St
- 632 Samuel Ave
- 537 Samuel Ave
- 525 Samuel Ave
- 427 Knox St
- 444 Emery Ave
- 718 E Laclede Ave
- 968 Cameron Ave
- 884 E Dewey Ave
- 0000 S Ave
- 834 Compton Ln
- 919 E Dewey Ave
- 941 E Dewey Ave
- 240 E Laclede Ave
- 603 E Indianola Ave
- 441 E Indianola Ave
- 2740 South Ave
- 0 Tampa Ave Unit 4420178
- 152 Regent St