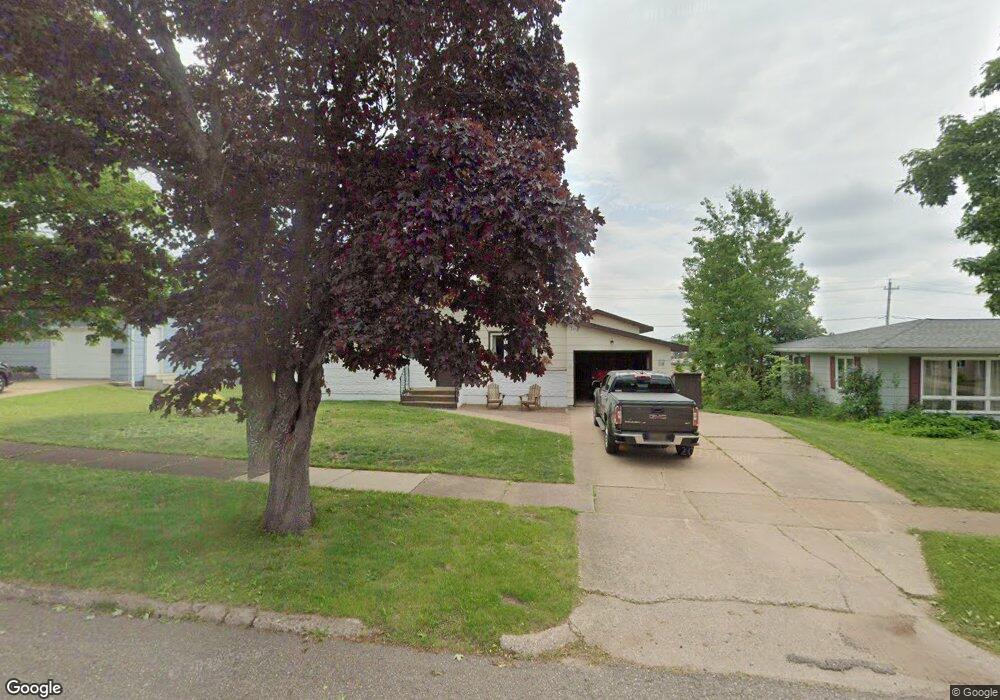
636 Mather Ave Ishpeming, MI 49849
Estimated Value: $231,000 - $257,000
3
Beds
2
Baths
1,320
Sq Ft
$180/Sq Ft
Est. Value
About This Home
This home is located at 636 Mather Ave, Ishpeming, MI 49849 and is currently estimated at $238,177, approximately $180 per square foot. 636 Mather Ave is a home located in Marquette County with nearby schools including Birchview School, Ishpeming Middle School, and Ishpeming High School.
Ownership History
Date
Name
Owned For
Owner Type
Purchase Details
Closed on
Mar 20, 2024
Sold by
Wealton Thomas E
Bought by
Thomas E Wealton Trust and Pepin
Current Estimated Value
Purchase Details
Closed on
Feb 16, 2022
Sold by
Wealton Thomas E
Bought by
Thomas E Wealton Revocable Living Trust
Purchase Details
Closed on
May 20, 2021
Sold by
Wealton Thomas E
Bought by
Wealton Thomas E and Thomas E Wealton Revocable Living Trust
Purchase Details
Closed on
Mar 31, 2021
Sold by
Wealton Thomas E and Wealton Helen P
Bought by
Wealton Thomas E
Purchase Details
Closed on
Apr 18, 2019
Sold by
Wealton Thomas E and Wealton Helen P
Bought by
Wealton Thomas E and Wealton Helen P
Create a Home Valuation Report for This Property
The Home Valuation Report is an in-depth analysis detailing your home's value as well as a comparison with similar homes in the area
Home Values in the Area
Average Home Value in this Area
Purchase History
| Date | Buyer | Sale Price | Title Company |
|---|---|---|---|
| Thomas E Wealton Trust | -- | None Listed On Document | |
| Thomas E Wealton Revocable Living Trust | -- | Steward & Sheridan | |
| Wealton Thomas E | -- | Steward & Sheridan | |
| Wealton Thomas E | -- | Steward & Sheridan Pc | |
| Wealton Thomas E | -- | Steward & Sheridan Pc | |
| Wealton Thomas E | -- | -- |
Source: Public Records
Tax History
| Year | Tax Paid | Tax Assessment Tax Assessment Total Assessment is a certain percentage of the fair market value that is determined by local assessors to be the total taxable value of land and additions on the property. | Land | Improvement |
|---|---|---|---|---|
| 2025 | $1,239 | $93,550 | $0 | $0 |
| 2024 | $12 | $80,200 | $0 | $0 |
| 2023 | $493 | $76,150 | $0 | $0 |
| 2022 | $2,996 | $59,500 | $0 | $0 |
| 2021 | $2,097 | $59,500 | $0 | $0 |
| 2020 | $2,053 | $59,500 | $0 | $0 |
| 2019 | $2,019 | $57,650 | $0 | $0 |
| 2018 | $1,959 | $54,250 | $0 | $0 |
| 2017 | $1,906 | $54,250 | $0 | $0 |
| 2016 | $1,843 | $52,600 | $0 | $0 |
| 2015 | -- | $52,600 | $0 | $0 |
| 2014 | -- | $49,600 | $0 | $0 |
| 2012 | -- | $48,450 | $0 | $0 |
Source: Public Records
Map
Nearby Homes
- 684 Mather Ave
- 645 Palms Ave
- TBD Us Highway 41
- 2115 Deer Lake Ave
- 408 E Empire St
- 635 N 5th St
- 818 N Pine St
- 704 N Main St
- 208 Shoreline Dr
- 113 N 2nd St
- 312 W Ridge St
- 401 Cleveland Ave
- 315 S 1st St
- 114 E Superior St
- 242 Hill St
- 349 Us Highway 41
- 260 Water St
- 000000 Us Highway 41
- 754 Cooper Lake Rd
- 604 County Rd
Your Personal Tour Guide
Ask me questions while you tour the home.