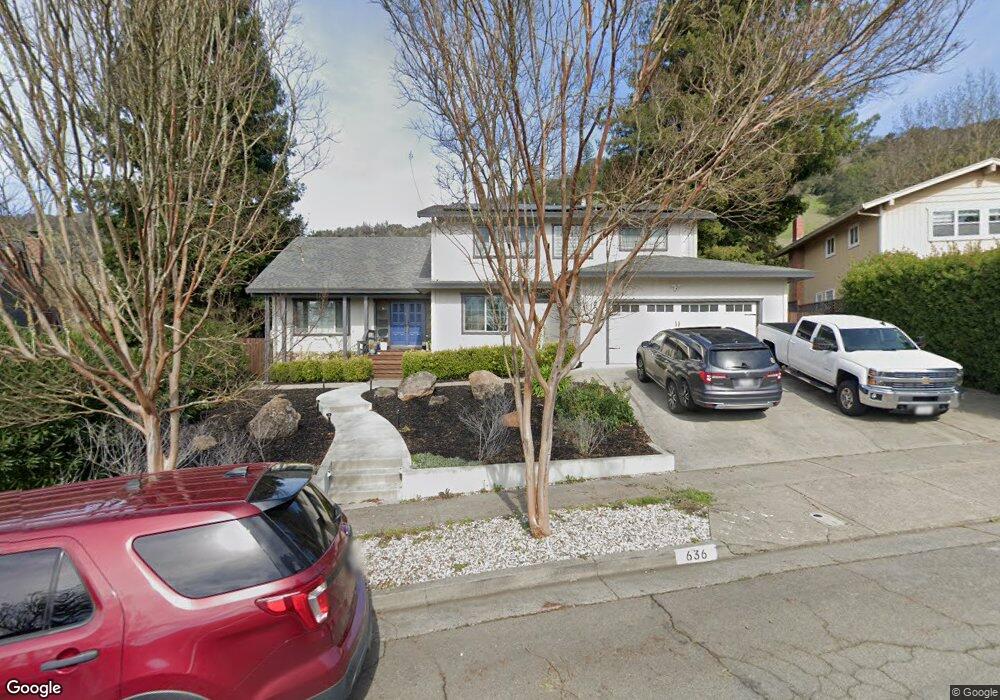
636 Rinaldo St Santa Rosa, CA 95409
Skyhawk NeighborhoodEstimated Value: $995,727 - $1,085,000
4
Beds
3
Baths
2,756
Sq Ft
$381/Sq Ft
Est. Value
About This Home
This home is located at 636 Rinaldo St, Santa Rosa, CA 95409 and is currently estimated at $1,049,182, approximately $380 per square foot. 636 Rinaldo St is a home located in Sonoma County with nearby schools including Sequoia Elementary School, Rincon Valley Middle School, and Maria Carrillo High School.
Ownership History
Date
Name
Owned For
Owner Type
Purchase Details
Closed on
Dec 17, 2021
Sold by
Hackett Daniel V and Hackett Tara L
Bought by
Daniel V And Tara L Hackett Family 2010 Revoc and Fa Tara
Current Estimated Value
Home Financials for this Owner
Home Financials are based on the most recent Mortgage that was taken out on this home.
Original Mortgage
$593,000
Outstanding Balance
$496,757
Interest Rate
2.98%
Mortgage Type
New Conventional
Estimated Equity
$552,425
Purchase Details
Closed on
Aug 15, 2017
Sold by
Hackett Daniel V and Hackett Tara
Bought by
Hackett Daniel V and Hackett Tara L
Purchase Details
Closed on
Sep 10, 2015
Sold by
Hackett Steve Rex and Hackett Evelyn
Bought by
Hackett Daniel V and Hackett Tara
Home Financials for this Owner
Home Financials are based on the most recent Mortgage that was taken out on this home.
Original Mortgage
$520,000
Interest Rate
3.86%
Mortgage Type
New Conventional
Purchase Details
Closed on
Mar 31, 1992
Bought by
Hackett Daniel V and Hackett Tara
Create a Home Valuation Report for This Property
The Home Valuation Report is an in-depth analysis detailing your home's value as well as a comparison with similar homes in the area
Home Values in the Area
Average Home Value in this Area
Purchase History
| Date | Buyer | Sale Price | Title Company |
|---|---|---|---|
| Daniel V And Tara L Hackett Family 2010 Revoc | -- | Amrock | |
| Hackett Daniel V | -- | Amrock | |
| Hackett Daniel V | -- | None Available | |
| Hackett Daniel V | $750,000 | North Coast Title Co | |
| Hackett Daniel V | $272,000 | -- | |
| Hackett Daniel V | $272,000 | -- |
Source: Public Records
Mortgage History
| Date | Status | Borrower | Loan Amount |
|---|---|---|---|
| Open | Hackett Daniel V | $593,000 | |
| Previous Owner | Hackett Daniel V | $520,000 |
Source: Public Records
Tax History
| Year | Tax Paid | Tax Assessment Tax Assessment Total Assessment is a certain percentage of the fair market value that is determined by local assessors to be the total taxable value of land and additions on the property. | Land | Improvement |
|---|---|---|---|---|
| 2025 | $5,475 | $472,251 | $164,938 | $307,313 |
| 2024 | $5,475 | $462,992 | $161,704 | $301,288 |
| 2023 | $5,475 | $453,915 | $158,534 | $295,381 |
| 2022 | $5,054 | $445,016 | $155,426 | $289,590 |
| 2021 | $4,953 | $436,291 | $152,379 | $283,912 |
| 2020 | $4,934 | $431,818 | $150,817 | $281,001 |
| 2019 | $4,887 | $423,352 | $147,860 | $275,492 |
| 2018 | $4,855 | $415,052 | $144,961 | $270,091 |
| 2017 | $4,765 | $406,915 | $142,119 | $264,796 |
| 2016 | $4,712 | $398,937 | $139,333 | $259,604 |
| 2015 | $4,571 | $392,946 | $137,241 | $255,705 |
| 2014 | $4,404 | $385,250 | $134,553 | $250,697 |
Source: Public Records
Map
Nearby Homes
- 840 Vaughn Ct
- 833 Vaughn Ct
- 88 Coronado Cir Unit 97
- 86 Coronado Cir
- 70 Coronado Cir
- 28 Springhill Ct
- 5116 Oak Park Way
- 408 Calistoga Rd
- 1535 Saint Francis Rd
- 341 La Crosse Ave
- 192 Mosshill Ct
- 1104 Calistoga Rd
- 172 Brookview Ct
- 91 Greenrock Ct
- 173 Brookview Ct
- 405 Korbel Place
- 5330 Marit Dr
- 5827 La Cuesta Dr
- 6900 Montecito Blvd
- 4911 Oak Park Way
- 640 Rinaldo St
- 632 Rinaldo St
- 644 Rinaldo St
- 637 Rinaldo St
- 628 Rinaldo St
- 631 Rinaldo St
- 649 Rinaldo St
- 5250 Piedmont Ct
- 648 Rinaldo St
- 624 Rinaldo St
- 625 Rinaldo St
- 5246 Piedmont Ct
- 624 Crestmont Dr
- 653 Rinaldo St
- 652 Rinaldo St
- 620 Rinaldo St
- 619 Rinaldo St
- 5251 Piedmont Ct
- 5240 Piedmont Ct
- 632 Crestmont Dr
Your Personal Tour Guide
Ask me questions while you tour the home.