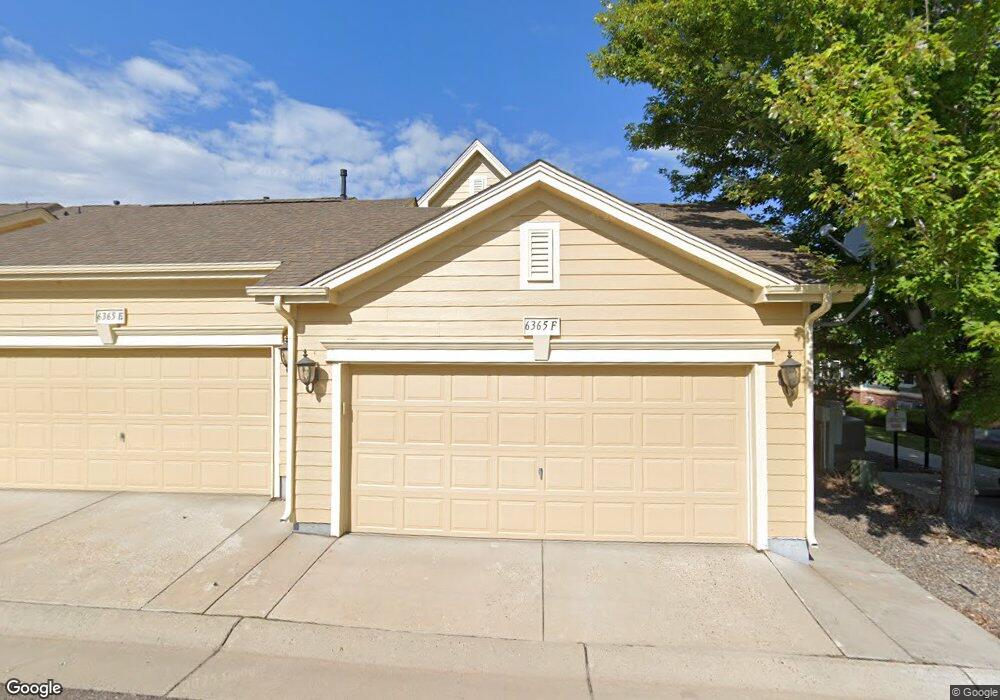
6365 Orion Ct Unit D Arvada, CO 80403
Estimated Value: $545,994 - $638,000
3
Beds
3
Baths
1,775
Sq Ft
$340/Sq Ft
Est. Value
About This Home
This home is located at 6365 Orion Ct Unit D, Arvada, CO 80403 and is currently estimated at $602,999, approximately $339 per square foot. 6365 Orion Ct Unit D is a home located in Jefferson County with nearby schools including Fairmount Elementary School, Drake Junior High School, and Arvada West High School.
Ownership History
Date
Name
Owned For
Owner Type
Purchase Details
Closed on
Apr 22, 2016
Sold by
Enyart Crystal Grace
Bought by
Enyart Crystal G and Enyart Nathaniel J
Current Estimated Value
Home Financials for this Owner
Home Financials are based on the most recent Mortgage that was taken out on this home.
Original Mortgage
$229,950
Outstanding Balance
$142,624
Interest Rate
3.73%
Mortgage Type
New Conventional
Estimated Equity
$460,375
Purchase Details
Closed on
Jan 27, 2016
Sold by
Patton Crystal Grace
Bought by
Enyart Crystal Grace
Purchase Details
Closed on
Sep 29, 2009
Sold by
Village Homes Of Colorado Inc
Bought by
Patton Crystal Grace
Home Financials for this Owner
Home Financials are based on the most recent Mortgage that was taken out on this home.
Original Mortgage
$257,254
Interest Rate
5.12%
Mortgage Type
FHA
Create a Home Valuation Report for This Property
The Home Valuation Report is an in-depth analysis detailing your home's value as well as a comparison with similar homes in the area
Home Values in the Area
Average Home Value in this Area
Purchase History
| Date | Buyer | Sale Price | Title Company |
|---|---|---|---|
| Enyart Crystal G | -- | First Integrity Title | |
| Enyart Crystal Grace | -- | None Available | |
| Patton Crystal Grace | $262,000 | Land Title Guarantee Company |
Source: Public Records
Mortgage History
| Date | Status | Borrower | Loan Amount |
|---|---|---|---|
| Open | Enyart Crystal G | $229,950 | |
| Previous Owner | Patton Crystal Grace | $257,254 |
Source: Public Records
Tax History Compared to Growth
Tax History
| Year | Tax Paid | Tax Assessment Tax Assessment Total Assessment is a certain percentage of the fair market value that is determined by local assessors to be the total taxable value of land and additions on the property. | Land | Improvement |
|---|---|---|---|---|
| 2024 | $3,172 | $32,704 | $6,030 | $26,674 |
| 2023 | $3,172 | $32,704 | $6,030 | $26,674 |
| 2022 | $2,593 | $26,475 | $4,170 | $22,305 |
| 2021 | $2,636 | $27,237 | $4,290 | $22,947 |
| 2020 | $2,701 | $27,987 | $4,290 | $23,697 |
| 2019 | $2,664 | $27,987 | $4,290 | $23,697 |
| 2018 | $2,765 | $28,241 | $3,600 | $24,641 |
| 2017 | $2,531 | $28,241 | $3,600 | $24,641 |
| 2016 | $2,332 | $24,509 | $4,776 | $19,733 |
| 2015 | $2,066 | $24,509 | $4,776 | $19,733 |
| 2014 | $2,066 | $20,410 | $2,229 | $18,181 |
Source: Public Records
Map
Nearby Homes
- 15952 W 63rd Ln Unit A
- 6268 Pike Ct Unit D
- 16019 W 62nd Dr
- 15902 W 64th Ave
- 6476 Orion Way
- 6462 Quartz Cir
- 6271 Mcintyre Way
- 16690 W 63rd Place
- 16887 W 62nd Place
- 15492 W 65th Ave Unit C
- 6264 Salvia Ln
- 16929 W 63rd Ln
- 15374 W 63rd Ave Unit 101
- 15496 W 66th Dr Unit C
- 16965 W 62nd Cir
- 15516 W 66th Dr Unit A
- 15894 W 67th Place
- 15957 W 60th Cir
- 15233 W 65th Ave Unit C
- 15296 W 66th Dr Unit G
- 6365 Orion Ct Unit F
- 6365 Orion Ct Unit E
- 6365 Orion Ct Unit C
- 6365 Orion Ct Unit A
- 16155 W 62nd Ln Unit D
- 16155 W 62nd Ln Unit A
- 16155 W 62nd Ln Unit C
- 6365 Orion (#F) Ct
- 16132 W 63rd Ln Unit E
- 16132 W 63rd Ln Unit B
- 16132 W 63rd Ln Unit A
- 16132 W 63rd Ln Unit 6E
- 16132 W 63rd Ln
- 16132 W 63rd Ln Unit C
- 16085 W 62nd Ln Unit A
- 16085 W 62nd Ln Unit C
- 16085 W 62nd Ln Unit E
- 16085 W 62nd Ln Unit B
- 16085 W 62nd Ln Unit F
- 16213 W 63rd Place