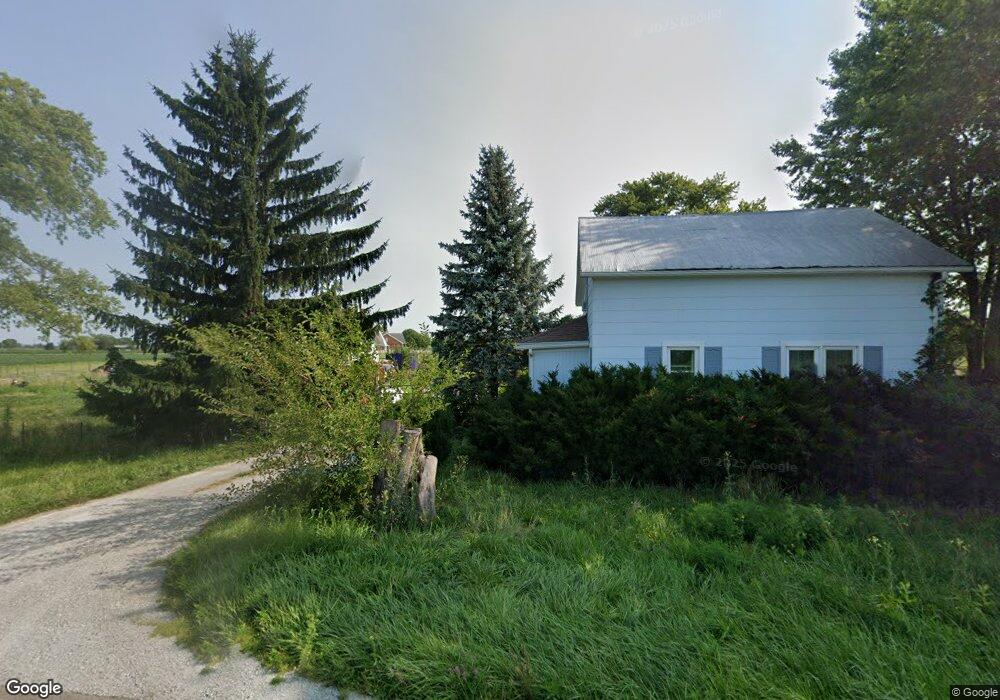
6365 W State Route 41 Covington, OH 45318
Estimated Value: $206,000 - $339,000
2
Beds
2
Baths
1,417
Sq Ft
$194/Sq Ft
Est. Value
About This Home
This home is located at 6365 W State Route 41, Covington, OH 45318 and is currently estimated at $275,353, approximately $194 per square foot. 6365 W State Route 41 is a home located in Miami County with nearby schools including Covington Elementary/Junior High School, Covington Junior High School, and Covington High School.
Ownership History
Date
Name
Owned For
Owner Type
Purchase Details
Closed on
Jun 15, 2017
Sold by
Cooper Elisha and Cooper Joshua A
Bought by
Oberlander Travis J and Roemisch Chelsea M
Current Estimated Value
Home Financials for this Owner
Home Financials are based on the most recent Mortgage that was taken out on this home.
Original Mortgage
$125,757
Outstanding Balance
$104,604
Interest Rate
4.02%
Mortgage Type
New Conventional
Estimated Equity
$170,749
Purchase Details
Closed on
Jul 22, 2015
Sold by
Lenehan Jon L and Lenehan Vivian L
Bought by
Cooper Elisha and Cooper Joshua A
Purchase Details
Closed on
Jul 2, 2015
Sold by
Lenehan Jon L and Lenehan Vivian L
Bought by
Cooper Elisha and Cooper Joshua A
Purchase Details
Closed on
Sep 17, 1990
Sold by
Jennings Larry W L
Bought by
Amber Lee Jennings
Create a Home Valuation Report for This Property
The Home Valuation Report is an in-depth analysis detailing your home's value as well as a comparison with similar homes in the area
Home Values in the Area
Average Home Value in this Area
Purchase History
| Date | Buyer | Sale Price | Title Company |
|---|---|---|---|
| Oberlander Travis J | $124,500 | None Available | |
| Cooper Elisha | $50,000 | Attorney | |
| Cooper Elisha | $50,000 | Attorney | |
| Amber Lee Jennings | -- | -- |
Source: Public Records
Mortgage History
| Date | Status | Borrower | Loan Amount |
|---|---|---|---|
| Open | Oberlander Travis J | $125,757 |
Source: Public Records
Tax History Compared to Growth
Tax History
| Year | Tax Paid | Tax Assessment Tax Assessment Total Assessment is a certain percentage of the fair market value that is determined by local assessors to be the total taxable value of land and additions on the property. | Land | Improvement |
|---|---|---|---|---|
| 2024 | $2,701 | $80,020 | $26,640 | $53,380 |
| 2023 | $2,701 | $58,180 | $26,640 | $31,540 |
| 2022 | $1,980 | $58,180 | $26,640 | $31,540 |
| 2021 | $1,630 | $44,740 | $20,480 | $24,260 |
| 2020 | $1,634 | $44,740 | $20,480 | $24,260 |
| 2019 | $1,630 | $44,740 | $20,480 | $24,260 |
| 2018 | $1,263 | $35,290 | $15,440 | $19,850 |
| 2017 | $1,312 | $35,290 | $15,440 | $19,850 |
| 2016 | $801 | $22,370 | $15,440 | $6,930 |
| 2015 | $784 | $23,770 | $14,560 | $9,210 |
| 2014 | $784 | $23,770 | $14,560 | $9,210 |
| 2013 | $860 | $23,770 | $14,560 | $9,210 |
Source: Public Records
Map
Nearby Homes
- 219 Henry Ct
- 221 Henry Ct
- 207 Charles Ct
- 212 Charles Ct
- 210 Charles Ct
- 205 Charles Ct
- 208 Charles Ct
- 203 Charles Ct
- 201 Charles Ct
- 206 Charles Ct
- 204 Charles Ct
- 200 Charles Ct
- 202 Charles Ct
- 536 S High St
- 221 S High St
- 271 N Ludlow St
- 698 E Broadway St
- 00 W Piqua Clay Rd
- 223 Henry Ct
- 8341 W Covington Gettysburg Rd
- 6299 W State Route 41
- 6255 W State Route 41
- 6457 W State Route 41
- 6262 W Farrington Rd
- 6565 W State Route 41
- 6581 W State Route 41
- 6165 W Farrington Rd
- 6140 W State Route 41
- 6611 W Farrington Rd
- 6605 W State Route 41
- 6616 W State Route 41
- 6655 W Farrington Rd
- 6650 W State Route 41
- 4675 N Mulberry Grv Rake Rd
- 6009 W Farrington Rd
- 4755 N Mulberry Grv Rake Rd
- 5980 W State Route 41
- 3830 N Rench Rd
- 3815 N Rench Rd
- 5970 W State Route 41