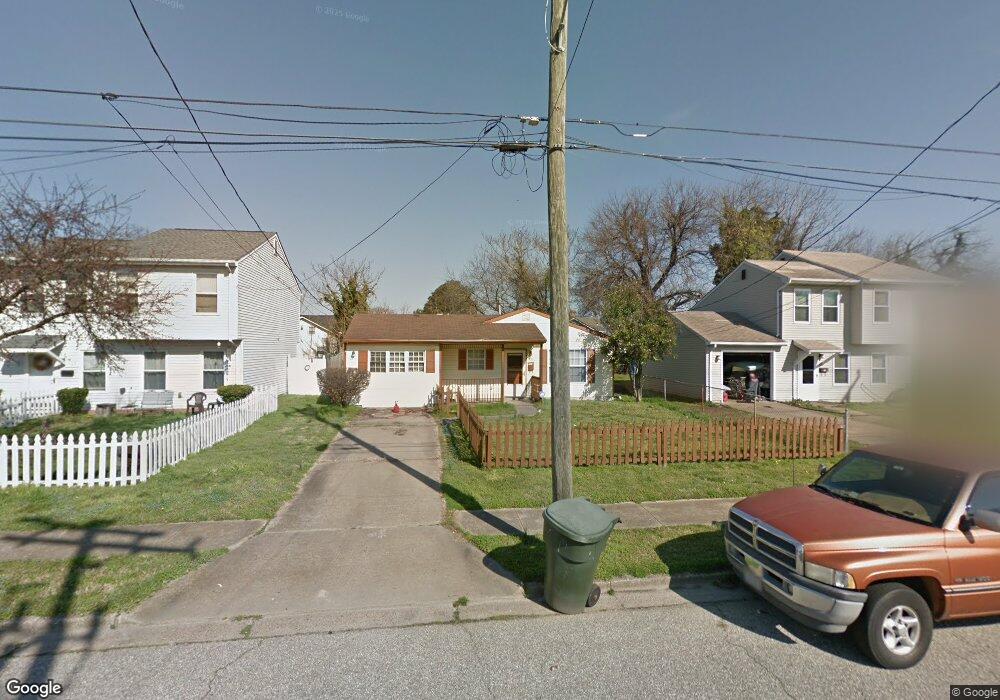
637 21st St Newport News, VA 23607
Tuckers Creek NeighborhoodEstimated Value: $173,000 - $229,183
3
Beds
2
Baths
1,690
Sq Ft
$118/Sq Ft
Est. Value
About This Home
This home is located at 637 21st St, Newport News, VA 23607 and is currently estimated at $199,796, approximately $118 per square foot. 637 21st St is a home located in Newport News City with nearby schools including B.C. Charles Elementary School, Huntington Middle School, and Warwick High School.
Ownership History
Date
Name
Owned For
Owner Type
Purchase Details
Closed on
Jan 5, 2007
Sold by
E Z Way Invests L L C
Bought by
Knight James J
Current Estimated Value
Home Financials for this Owner
Home Financials are based on the most recent Mortgage that was taken out on this home.
Original Mortgage
$143,825
Outstanding Balance
$86,093
Interest Rate
6.24%
Mortgage Type
New Conventional
Estimated Equity
$113,703
Purchase Details
Closed on
Jul 25, 2006
Sold by
Cannon Mark L
Bought by
E Z Way Investments
Create a Home Valuation Report for This Property
The Home Valuation Report is an in-depth analysis detailing your home's value as well as a comparison with similar homes in the area
Home Values in the Area
Average Home Value in this Area
Purchase History
| Date | Buyer | Sale Price | Title Company |
|---|---|---|---|
| Knight James J | $145,000 | -- | |
| E Z Way Investments | $72,000 | -- |
Source: Public Records
Mortgage History
| Date | Status | Borrower | Loan Amount |
|---|---|---|---|
| Open | Knight James J | $143,825 |
Source: Public Records
Tax History Compared to Growth
Tax History
| Year | Tax Paid | Tax Assessment Tax Assessment Total Assessment is a certain percentage of the fair market value that is determined by local assessors to be the total taxable value of land and additions on the property. | Land | Improvement |
|---|---|---|---|---|
| 2024 | $2,336 | $198,000 | $29,700 | $168,300 |
| 2023 | $1,795 | $139,700 | $20,500 | $119,200 |
| 2022 | $1,562 | $117,900 | $15,800 | $102,100 |
| 2021 | $1,272 | $92,200 | $11,300 | $80,900 |
| 2020 | $1,178 | $84,500 | $9,000 | $75,500 |
| 2019 | $1,129 | $80,900 | $9,000 | $71,900 |
| 2018 | $1,126 | $80,900 | $9,000 | $71,900 |
| 2017 | $1,126 | $80,900 | $9,000 | $71,900 |
| 2016 | $1,122 | $80,900 | $9,000 | $71,900 |
| 2015 | $1,153 | $83,900 | $12,000 | $71,900 |
| 2014 | $1,140 | $90,700 | $15,000 | $75,700 |
Source: Public Records
Map
Nearby Homes