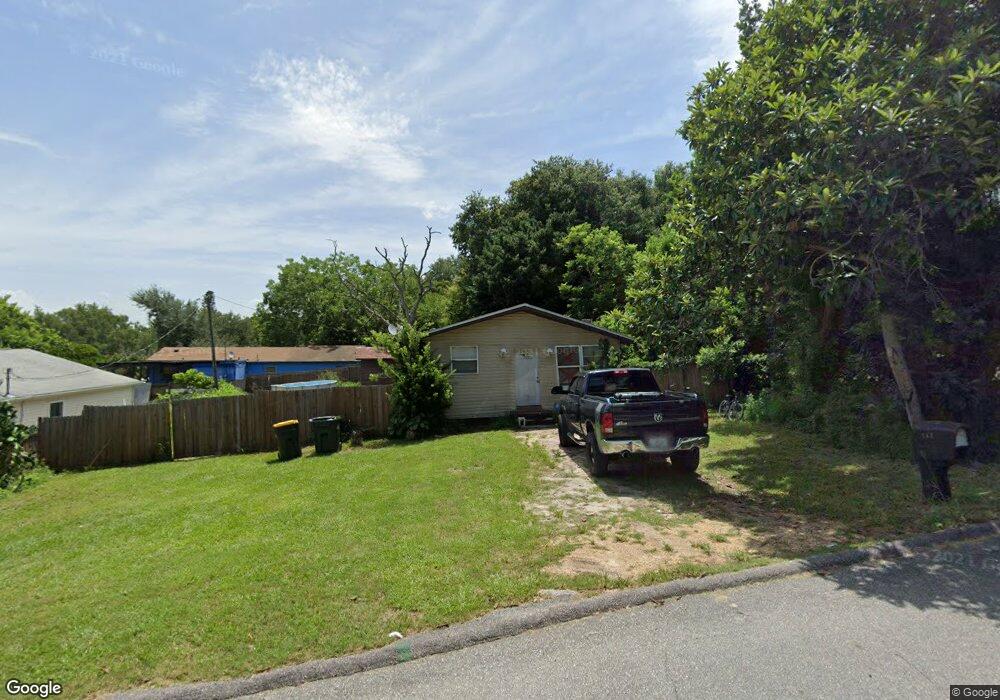
637 Disston Ave Clermont, FL 34711
Estimated Value: $202,271 - $340,000
3
Beds
1
Bath
1,000
Sq Ft
$262/Sq Ft
Est. Value
About This Home
This home is located at 637 Disston Ave, Clermont, FL 34711 and is currently estimated at $261,818, approximately $261 per square foot. 637 Disston Ave is a home located in Lake County with nearby schools including Aurelia Cole Academy, South Lake High School, and Wesley Christian Academy.
Ownership History
Date
Name
Owned For
Owner Type
Purchase Details
Closed on
Mar 16, 2016
Sold by
Wahab Twahira N
Bought by
Khan Rozina
Current Estimated Value
Purchase Details
Closed on
Apr 3, 2012
Sold by
Paul Anthony
Bought by
Wahab Twahira N
Purchase Details
Closed on
Sep 13, 2010
Sold by
Khan Rozina
Bought by
Paul Anthony
Purchase Details
Closed on
Sep 16, 2009
Sold by
Us Bank National Association
Bought by
Khan Rozina
Purchase Details
Closed on
Jan 29, 2009
Sold by
Persaud Indranie D and Clark Nathan
Bought by
Us Bank National Association and Credit Suisse First Boston Mortgage Secu
Purchase Details
Closed on
Jan 15, 2009
Sold by
Persaud Indranie D and Case #2007 Ca 003192
Bought by
Us Bank National Association and Credit Suisse First Boston Mortgage Secu
Purchase Details
Closed on
Oct 31, 2005
Sold by
Cole Lester
Bought by
Persaud Indramie D
Create a Home Valuation Report for This Property
The Home Valuation Report is an in-depth analysis detailing your home's value as well as a comparison with similar homes in the area
Home Values in the Area
Average Home Value in this Area
Purchase History
| Date | Buyer | Sale Price | Title Company |
|---|---|---|---|
| Khan Rozina | -- | None Available | |
| Wahab Twahira N | -- | None Available | |
| Paul Anthony | -- | None Available | |
| Khan Rozina | $23,500 | Landcastle Title Llc | |
| Us Bank National Association | -- | Attorney | |
| Us Bank National Association | -- | Attorney | |
| Persaud Indramie D | $40,000 | -- |
Source: Public Records
Tax History Compared to Growth
Tax History
| Year | Tax Paid | Tax Assessment Tax Assessment Total Assessment is a certain percentage of the fair market value that is determined by local assessors to be the total taxable value of land and additions on the property. | Land | Improvement |
|---|---|---|---|---|
| 2025 | $1,679 | $139,010 | $34,800 | $104,210 |
| 2024 | $1,679 | $139,010 | $34,800 | $104,210 |
| 2023 | $1,679 | $135,546 | $34,800 | $100,746 |
| 2022 | $1,611 | $135,546 | $34,800 | $100,746 |
| 2021 | $1,220 | $87,272 | $0 | $0 |
| 2020 | $967 | $56,610 | $0 | $0 |
| 2019 | $1,014 | $56,574 | $0 | $0 |
| 2018 | $999 | $56,574 | $0 | $0 |
| 2017 | $936 | $52,688 | $0 | $0 |
| 2016 | $922 | $52,688 | $0 | $0 |
| 2015 | $846 | $45,351 | $0 | $0 |
| 2014 | $818 | $44,670 | $0 | $0 |
Source: Public Records
Map
Nearby Homes
- 0 E Minneola Ave
- 472 Sheldon Place
- 461 E Desoto St
- 640 E Desoto St
- 833 Scott St
- 220 E Desoto St Unit 4
- 628 Drew Ave
- 747 Roane Rd
- 540 E Highland Ave
- 721 Pitt St Unit SR
- 820 E Desoto St
- 135 Carroll St
- 0 East Ave Unit MFRG5095417
- 211 Hunt St
- 225 W Osceola St
- 654 Harbor Villa Ct
- 0 Roys Rd Unit MFRO6235691
- 768 S Grand Hwy
- 1467 Disston Ave
- 1443 Disston Ave
- 625 Disston Ave
- 521 E Minneola Ave
- 655 Disston Ave
- 531 E Minneola Ave
- 670 Disston Ave
- 680 Disston Ave
- 541 E Minneola Ave
- 530 E Minneola Ave
- 548 E Montrose St
- 550 Disston Ave
- 660 Disston Ave
- 540 Disston Ave
- 478 Sheldon Place
- 505 E Montrose St
- 679 Anderson St
- 669 Anderson St
- 561 E Minneola Ave
- 560 E Montrose St
- 655 Anderson St
- 699 Anderson St