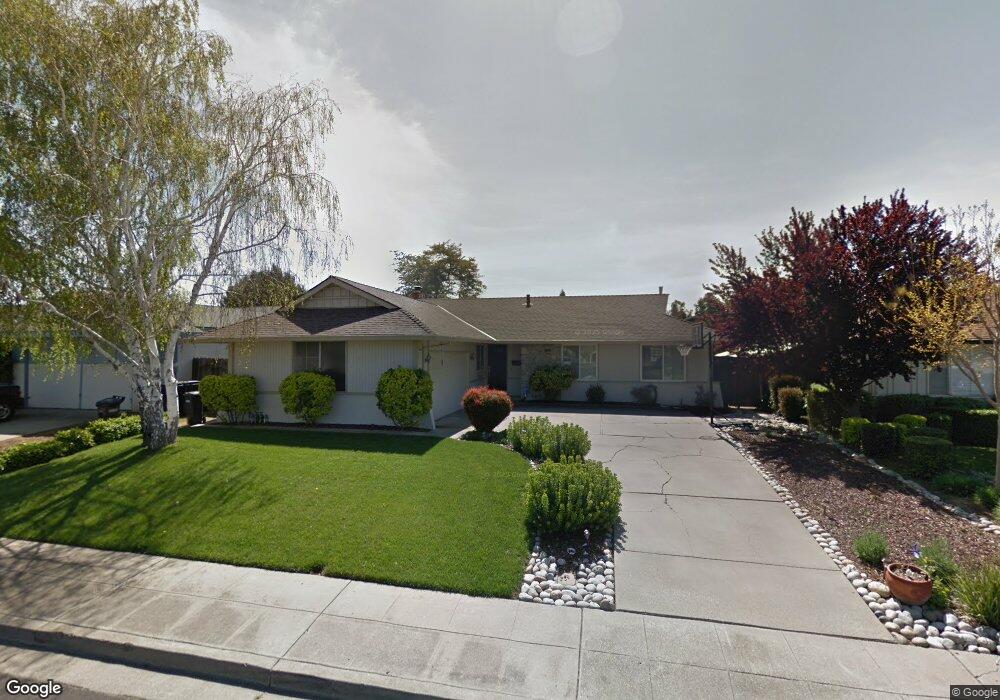
637 Dover Way Livermore, CA 94551
Summerset NeighborhoodEstimated Value: $1,059,000 - $1,123,000
4
Beds
2
Baths
1,333
Sq Ft
$825/Sq Ft
Est. Value
About This Home
This home is located at 637 Dover Way, Livermore, CA 94551 and is currently estimated at $1,099,802, approximately $825 per square foot. 637 Dover Way is a home located in Alameda County with nearby schools including Rancho Las Positas Elementary School, Junction Avenue K-8 School, and Granada High School.
Ownership History
Date
Name
Owned For
Owner Type
Purchase Details
Closed on
Aug 13, 2003
Sold by
Lego John P and Lego Stacey A
Bought by
Korsak Georg and Korsak Kimberly
Current Estimated Value
Home Financials for this Owner
Home Financials are based on the most recent Mortgage that was taken out on this home.
Original Mortgage
$411,900
Outstanding Balance
$179,269
Interest Rate
5.46%
Mortgage Type
Purchase Money Mortgage
Estimated Equity
$920,533
Purchase Details
Closed on
Nov 20, 2002
Sold by
Lego John P and Lego Stacey A
Bought by
Lego John P and Lego Stacey A
Home Financials for this Owner
Home Financials are based on the most recent Mortgage that was taken out on this home.
Original Mortgage
$290,000
Interest Rate
6.12%
Purchase Details
Closed on
Apr 18, 1998
Sold by
Lego John P and Lego Stacey A
Bought by
Lego John P and Lego Stacey A
Purchase Details
Closed on
Oct 7, 1997
Sold by
Hoggatt George D and Hoggatt Sharon D
Bought by
Lego John P and Lego Stacey A
Home Financials for this Owner
Home Financials are based on the most recent Mortgage that was taken out on this home.
Original Mortgage
$166,400
Interest Rate
7.54%
Create a Home Valuation Report for This Property
The Home Valuation Report is an in-depth analysis detailing your home's value as well as a comparison with similar homes in the area
Home Values in the Area
Average Home Value in this Area
Purchase History
| Date | Buyer | Sale Price | Title Company |
|---|---|---|---|
| Korsak Georg | $412,000 | Chicago Title Company | |
| Lego John P | -- | Alliance Title Company | |
| Lego John P | -- | Alliance Title Company | |
| Lego John P | -- | -- | |
| Lego John P | $208,000 | Golden California Title Co |
Source: Public Records
Mortgage History
| Date | Status | Borrower | Loan Amount |
|---|---|---|---|
| Open | Korsak Georg | $411,900 | |
| Previous Owner | Lego John P | $290,000 | |
| Previous Owner | Lego John P | $166,400 |
Source: Public Records
Tax History Compared to Growth
Tax History
| Year | Tax Paid | Tax Assessment Tax Assessment Total Assessment is a certain percentage of the fair market value that is determined by local assessors to be the total taxable value of land and additions on the property. | Land | Improvement |
|---|---|---|---|---|
| 2025 | $7,394 | $561,541 | $170,463 | $398,078 |
| 2024 | $7,394 | $550,396 | $167,121 | $390,275 |
| 2023 | $7,278 | $546,466 | $163,844 | $382,622 |
| 2022 | $7,168 | $528,753 | $160,632 | $375,121 |
| 2021 | $7,019 | $518,251 | $157,483 | $367,768 |
| 2020 | $6,810 | $519,870 | $155,870 | $364,000 |
| 2019 | $6,834 | $509,675 | $152,813 | $356,862 |
| 2018 | $6,684 | $499,682 | $149,817 | $349,865 |
| 2017 | $6,509 | $489,884 | $146,879 | $343,005 |
| 2016 | $6,264 | $480,279 | $143,999 | $336,280 |
| 2015 | $5,879 | $473,064 | $141,836 | $331,228 |
| 2014 | $5,775 | $463,799 | $139,058 | $324,741 |
Source: Public Records
Map
Nearby Homes
- 651 Brookfield Dr
- 646 Brighton Way
- 1059 Lakehurst Rd
- 635 Zermatt St
- 761 Pine St
- 727 Sandpiper Common
- 866 Cortland Way
- 1567 Wilton Rd
- 693 Mayten Dr
- 847 Crane Ave
- 303 Garden Common
- 1033 Plumas Ct
- 678 Crane Ave
- 848 Del Norte Dr
- 1052 Rincon Ave
- 771 Hagemann Dr
- 1186 Via Cristobal Unit 110
- 1727 Sutter St
- 1382 Vía Deste Unit 61
- 1244 Locust St
- 631 Dover Way
- 653 Dover Way
- 650 Brookfield Dr
- 648 Brookfield Dr
- 662 Brookfield Dr
- 669 Dover Way
- 625 Dover Way
- 676 Brookfield Dr
- 634 Brookfield Dr
- 664 Chase Ct
- 638 Dover Way
- 619 Dover Way
- 675 Dover Way
- 626 Brookfield Dr
- 632 Dover Way
- 684 Brookfield Dr
- 1216 Lakehurst Rd
- 660 Chase Ct
- 603 Dover Way
- 626 Dover Way