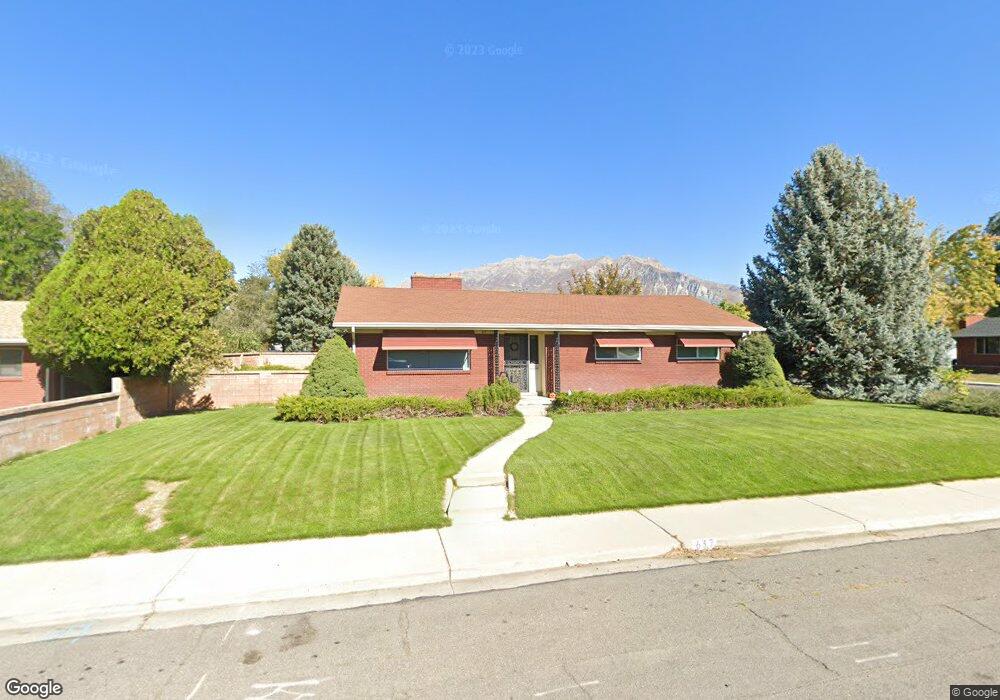
637 E 400 S Orem, UT 84097
SCERA NeighborhoodEstimated Value: $504,000 - $539,000
5
Beds
3
Baths
2,612
Sq Ft
$200/Sq Ft
Est. Value
About This Home
This home is located at 637 E 400 S, Orem, UT 84097 and is currently estimated at $522,096, approximately $199 per square foot. 637 E 400 S is a home located in Utah County with nearby schools including Centennial Elementary, Lakeridge Jr High School, and Orem High School.
Ownership History
Date
Name
Owned For
Owner Type
Purchase Details
Closed on
Oct 11, 2019
Sold by
Liston Pamela J
Bought by
Carter Rodney
Current Estimated Value
Home Financials for this Owner
Home Financials are based on the most recent Mortgage that was taken out on this home.
Original Mortgage
$254,000
Outstanding Balance
$169,336
Interest Rate
3.5%
Mortgage Type
New Conventional
Estimated Equity
$352,760
Purchase Details
Closed on
Dec 28, 2007
Sold by
Spackman Audrey W
Bought by
Spackman Dennis Paul and Spackman Brent W
Purchase Details
Closed on
Jun 20, 2000
Sold by
Spackman Audrey W
Bought by
Spackman Audrey W and Spackman Dennis Paul
Create a Home Valuation Report for This Property
The Home Valuation Report is an in-depth analysis detailing your home's value as well as a comparison with similar homes in the area
Home Values in the Area
Average Home Value in this Area
Purchase History
| Date | Buyer | Sale Price | Title Company |
|---|---|---|---|
| Carter Rodney | -- | Old Republic Title | |
| Carter Rodney | -- | Old Republic Title | |
| Spackman Dennis Paul | -- | None Available | |
| Spackman Audrey W | -- | -- |
Source: Public Records
Mortgage History
| Date | Status | Borrower | Loan Amount |
|---|---|---|---|
| Open | Carter Rodney | $254,000 |
Source: Public Records
Tax History
| Year | Tax Paid | Tax Assessment Tax Assessment Total Assessment is a certain percentage of the fair market value that is determined by local assessors to be the total taxable value of land and additions on the property. | Land | Improvement |
|---|---|---|---|---|
| 2025 | $1,943 | $253,000 | -- | -- |
| 2024 | $1,943 | $237,600 | $0 | $0 |
| 2023 | $1,799 | $236,445 | $0 | $0 |
| 2022 | $1,861 | $236,995 | $0 | $0 |
| 2021 | $1,740 | $335,500 | $131,600 | $203,900 |
| 2020 | $1,610 | $305,200 | $105,300 | $199,900 |
| 2019 | $1,381 | $272,100 | $98,300 | $173,800 |
| 2018 | $1,336 | $251,600 | $94,700 | $156,900 |
| 2017 | $1,259 | $127,050 | $0 | $0 |
| 2016 | $1,243 | $115,665 | $0 | $0 |
| 2015 | $1,263 | $111,100 | $0 | $0 |
| 2014 | $1,205 | $105,490 | $0 | $0 |
Source: Public Records
Map
Nearby Homes
Your Personal Tour Guide
Ask me questions while you tour the home.