Estimated Value: $692,111 - $848,000
About This Home
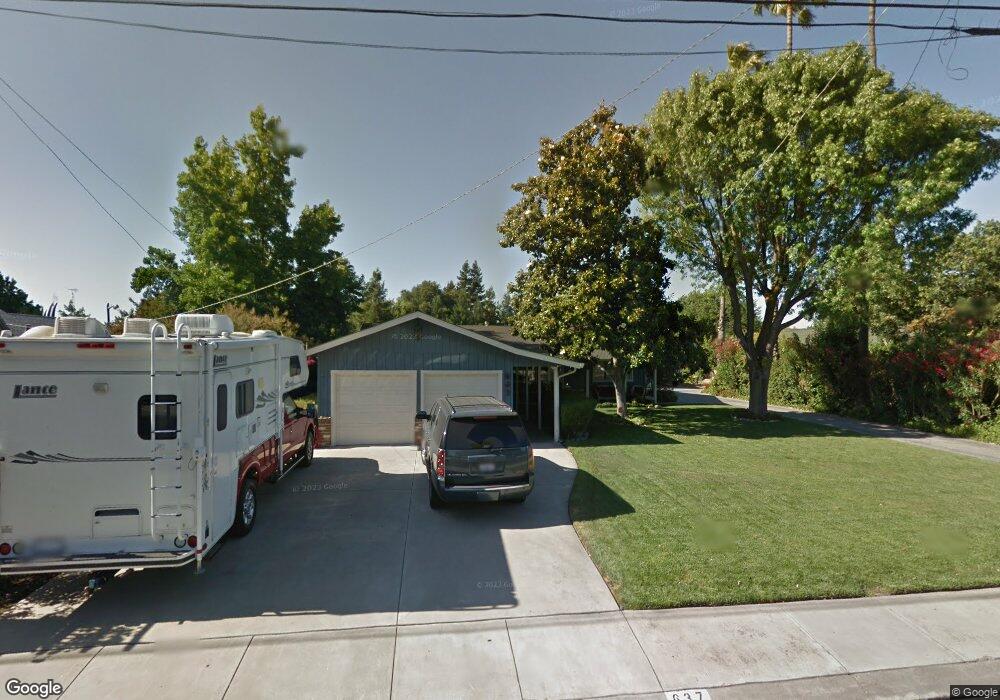
This home is located at 637 E Main St, Ripon, CA 95366 and is currently estimated at $744,778, approximately $398 per square foot. 637 E Main St is a home located in San Joaquin County with nearby schools including Ripona Elementary School, Ripon Elementary School, and Colony Oak Elementary School.
Ownership History
We collect this data history from publicly available records. To have your information removed, we recommend requesting removal directly through your county’s website.
Purchase Details
Purchase Details
Home Financials for this Owner
Home Financials are based on the most recent Mortgage that was taken out on this home.Home Values in the Area
Average Home Value in this Area
Purchase History
We collect this data history from publicly available records. To have your information removed, we recommend requesting removal directly through your county’s website.
| Date | Buyer | Sale Price | Title Company |
|---|---|---|---|
| -- | -- | ||
| -- | -- | ||
| $257,000 | Old Republic Title Company |
Mortgage History
We collect this data history from publicly available records. To have your information removed, we recommend requesting removal directly through your county’s website.
| Date | Status | Borrower | Loan Amount |
|---|---|---|---|
| Open | $231,300 |
Tax History
We collect this data history from publicly available records. To have your information removed, we recommend requesting removal directly through your county’s website.
| Year | Tax Paid | Tax Assessment Tax Assessment Total Assessment is a certain percentage of the fair market value that is determined by local assessors to be the total taxable value of land and additions on the property. | Land | Improvement |
|---|---|---|---|---|
| 2025 | $4,989 | $461,424 | $156,761 | $304,663 |
| 2024 | $4,906 | $452,378 | $153,688 | $298,690 |
| 2023 | $4,805 | $443,509 | $150,675 | $292,834 |
| 2022 | $4,728 | $434,814 | $147,721 | $287,093 |
| 2021 | $4,654 | $426,289 | $144,825 | $281,464 |
| 2020 | $4,611 | $421,918 | $143,340 | $278,578 |
| 2019 | $4,532 | $413,646 | $140,530 | $273,116 |
| 2018 | $4,461 | $405,536 | $137,775 | $267,761 |
| 2017 | $4,373 | $397,585 | $135,074 | $262,511 |
| 2016 | $4,300 | $389,791 | $132,426 | $257,365 |
| 2014 | $3,358 | $304,000 | $103,000 | $201,000 |
Map
- 230 Meyenberg Ave
- 185 Tiffany Cir
- 346 Oregon St
- 773 Mulholand Dr
- 503 Franklin Ln
- 762 E Milgeo Ave
- 428 E Milgeo Ave
- 263 Franklin Ln
- 924 E Milgeo Ave
- 777 Jordanolo Dr
- 1153 E Milgeo Ave
- 966 Shelly Ct
- 731 Nancy Dr
- 1084 Eastburg Ct
- 150 N Acacia Ave
- 845 Sunrise Ave
- 403 S Acacia Ave
- 505 S Acacia Ave
- 1234 Murphy Rd
- 822 N Acacia Ave
Ask me questions while you tour the home.