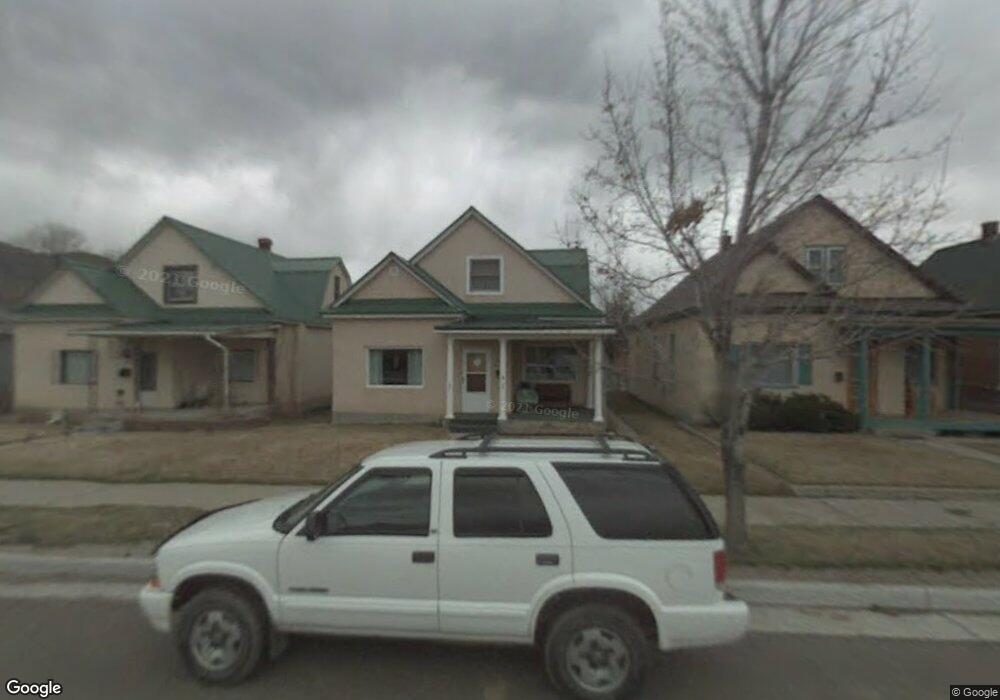
637 E St Salida, CO 81201
Estimated Value: $724,000 - $788,000
4
Beds
1
Bath
1,701
Sq Ft
$439/Sq Ft
Est. Value
About This Home
This home is located at 637 E St, Salida, CO 81201 and is currently estimated at $747,467, approximately $439 per square foot. 637 E St is a home located in Chaffee County with nearby schools including Longfellow Elementary School, Salida Middle School, and Horizons Exploratory Academy.
Ownership History
Date
Name
Owned For
Owner Type
Purchase Details
Closed on
Jan 6, 2021
Sold by
Blair Christopher and Blair Emilie
Bought by
Bison Garfield Llc
Current Estimated Value
Home Financials for this Owner
Home Financials are based on the most recent Mortgage that was taken out on this home.
Original Mortgage
$291,500
Outstanding Balance
$257,120
Interest Rate
2.7%
Mortgage Type
New Conventional
Estimated Equity
$490,347
Purchase Details
Closed on
Aug 20, 2008
Sold by
Post Arthur and Post Catherine
Bought by
Post Bernard A and Hemmert Christine M
Create a Home Valuation Report for This Property
The Home Valuation Report is an in-depth analysis detailing your home's value as well as a comparison with similar homes in the area
Home Values in the Area
Average Home Value in this Area
Purchase History
| Date | Buyer | Sale Price | Title Company |
|---|---|---|---|
| Bison Garfield Llc | -- | None Available | |
| Blair Christopher | $439,000 | None Available | |
| Post Bernard A | -- | -- |
Source: Public Records
Mortgage History
| Date | Status | Borrower | Loan Amount |
|---|---|---|---|
| Open | Blair Christopher | $291,500 |
Source: Public Records
Tax History
| Year | Tax Paid | Tax Assessment Tax Assessment Total Assessment is a certain percentage of the fair market value that is determined by local assessors to be the total taxable value of land and additions on the property. | Land | Improvement |
|---|---|---|---|---|
| 2025 | $1,891 | $43,320 | $12,870 | $30,450 |
| 2024 | $1,891 | $41,970 | $13,800 | $28,170 |
| 2023 | $1,829 | $41,970 | $13,800 | $28,170 |
| 2022 | $1,342 | $28,130 | $11,290 | $16,840 |
| 2021 | $1,315 | $28,290 | $11,610 | $16,680 |
| 2020 | $1,240 | $25,340 | $5,680 | $19,660 |
| 2019 | $892 | $18,190 | $4,080 | $14,110 |
| 2018 | $663 | $13,710 | $3,860 | $9,850 |
| 2017 | $646 | $13,710 | $3,860 | $9,850 |
| 2016 | $542 | $11,270 | $3,300 | $7,970 |
| 2015 | $651 | $11,270 | $3,300 | $7,970 |
| 2014 | $651 | $12,890 | $0 | $0 |
Source: Public Records
Map
Nearby Homes
Your Personal Tour Guide
Ask me questions while you tour the home.