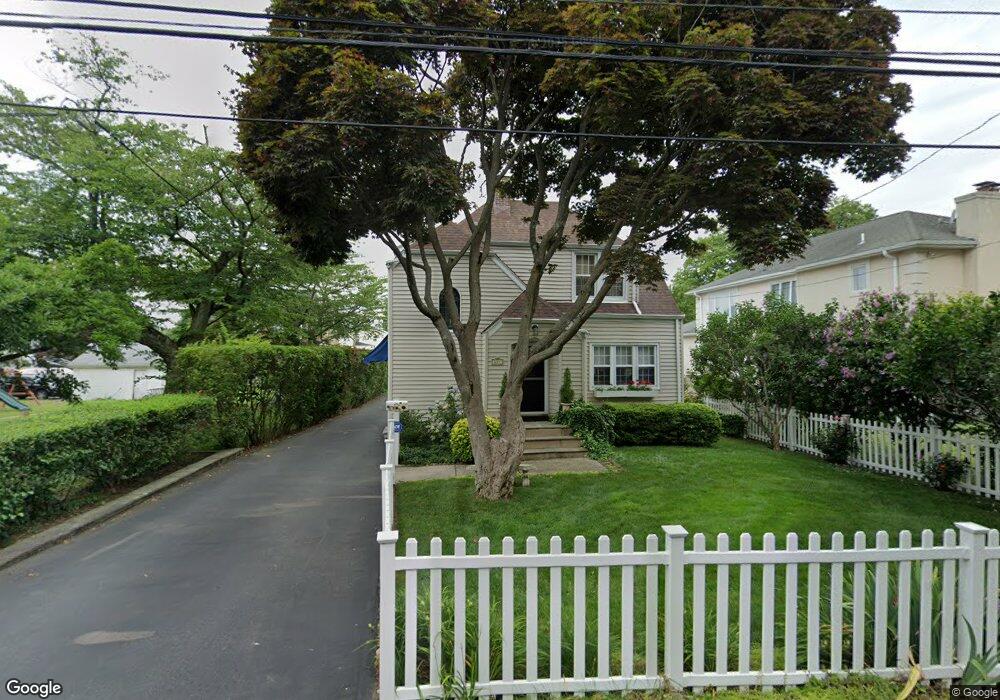
637 Fairfield Ave Stamford, CT 06902
Waterside NeighborhoodEstimated Value: $722,000 - $757,000
3
Beds
3
Baths
1,917
Sq Ft
$387/Sq Ft
Est. Value
About This Home
This home is located at 637 Fairfield Ave, Stamford, CT 06902 and is currently estimated at $741,513, approximately $386 per square foot. 637 Fairfield Ave is a home located in Fairfield County with nearby schools including Stillmeadow Elementary School, Cloonan School, and Westhill High School.
Ownership History
Date
Name
Owned For
Owner Type
Purchase Details
Closed on
Jul 2, 2019
Sold by
Mongillo Roswitha
Bought by
Mongillo Peter E and Mongillo Roswitha
Current Estimated Value
Home Financials for this Owner
Home Financials are based on the most recent Mortgage that was taken out on this home.
Original Mortgage
$718,500
Outstanding Balance
$710,065
Interest Rate
3.82%
Mortgage Type
Reverse Mortgage Home Equity Conversion Mortgage
Estimated Equity
$31,448
Purchase Details
Closed on
Dec 20, 2016
Sold by
Mongillo Rose F and Mongillo Peter E
Bought by
Mongillo Rose F and Mongillo Peter E
Purchase Details
Closed on
Nov 25, 2009
Sold by
Mongillo Rose F
Bought by
Mongillo Rose F and Mongillo Peter E
Create a Home Valuation Report for This Property
The Home Valuation Report is an in-depth analysis detailing your home's value as well as a comparison with similar homes in the area
Home Values in the Area
Average Home Value in this Area
Purchase History
| Date | Buyer | Sale Price | Title Company |
|---|---|---|---|
| Mongillo Peter E | -- | -- | |
| Mongillo Peter E | -- | -- | |
| Mongillo Rose F | -- | -- | |
| Mongillo Rose F | -- | -- | |
| Mongillo Rose F | -- | -- | |
| Mongillo Rose F | -- | -- |
Source: Public Records
Mortgage History
| Date | Status | Borrower | Loan Amount |
|---|---|---|---|
| Open | Mongillo Peter E | $718,500 | |
| Closed | Mongillo Peter E | $718,500 | |
| Previous Owner | Mongillo Rose F | $215,000 | |
| Previous Owner | Mongillo Rose F | $106,000 | |
| Previous Owner | Mongillo Rose F | $217,500 |
Source: Public Records
Tax History Compared to Growth
Tax History
| Year | Tax Paid | Tax Assessment Tax Assessment Total Assessment is a certain percentage of the fair market value that is determined by local assessors to be the total taxable value of land and additions on the property. | Land | Improvement |
|---|---|---|---|---|
| 2025 | $9,612 | $401,840 | $222,550 | $179,290 |
| 2024 | $9,387 | $401,840 | $222,550 | $179,290 |
| 2023 | $10,142 | $401,840 | $222,550 | $179,290 |
| 2022 | $8,499 | $312,800 | $161,220 | $151,580 |
| 2021 | $8,427 | $312,800 | $161,220 | $151,580 |
| 2020 | $8,242 | $312,800 | $161,220 | $151,580 |
| 2019 | $8,242 | $312,800 | $161,220 | $151,580 |
| 2018 | $7,986 | $312,800 | $161,220 | $151,580 |
| 2017 | $7,263 | $270,100 | $122,560 | $147,540 |
| 2016 | $7,055 | $270,100 | $122,560 | $147,540 |
| 2015 | $6,869 | $270,100 | $122,560 | $147,540 |
| 2014 | $6,696 | $270,100 | $122,560 | $147,540 |
Source: Public Records
Map
Nearby Homes
- 602 Fairfield Ave
- 42 Signal Rd
- 54 Signal Rd
- 50 Signal Rd
- 46 Signal Rd
- 20 Cook Rd
- 34 Davenport Dr
- 98 Southfield Ave Unit 101
- 7 Highview Ave
- 8 Park Ave
- 51 Forest Ave Unit 98
- 51 Forest Ave Unit 82
- 45 Binney Ln
- 348 Sound Beach Ave
- 40 Orchard St
- 11 Shorelands Place
- 137 Shore Rd
- 8 Quintard Ave
- 145 Shore Rd
- 61 Aberdeen St
- 631 Fairfield Ave
- 641 Fairfield Ave
- 15 Hendrie Ct
- 615 Fairfield Ave
- 647 Fairfield Ave
- 11 Hendrie Ct
- 4 Hendrie Ct
- 12 Hendrie Ct
- 21 Hendrie Ct
- 20 Hendrie Ct
- 16 Hendrie Ct
- 25 Hendrie Ct
- 24 Dee Ln
- 619 Fairfield Ave
- 619 Fairfield Ave Unit FRONT
- 605 Fairfield Ave
- 30 Dee Ln
- 115 Top Gallant Rd Unit 1
- 115 Top Gallant Rd Unit 3
- 115 Top Gallant Rd Unit 5