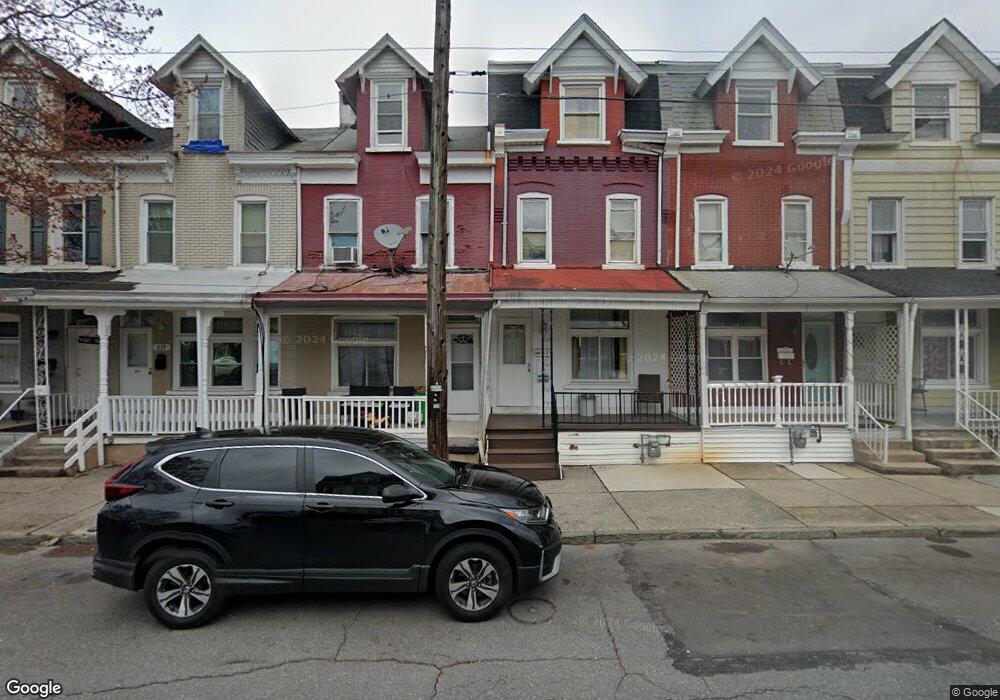
637 N 9th St Allentown, PA 18102
Center City NeighborhoodEstimated Value: $170,000 - $229,689
3
Beds
1
Bath
1,405
Sq Ft
$145/Sq Ft
Est. Value
About This Home
This home is located at 637 N 9th St, Allentown, PA 18102 and is currently estimated at $203,672, approximately $144 per square foot. 637 N 9th St is a home located in Lehigh County with nearby schools including Luis A. Ramos Elementary School, San Rafael Junior High School, and Trexler Middle School.
Ownership History
Date
Name
Owned For
Owner Type
Purchase Details
Closed on
Jan 27, 2021
Sold by
Benitez Milagros
Bought by
Bencosme Jose V Angeles
Current Estimated Value
Home Financials for this Owner
Home Financials are based on the most recent Mortgage that was taken out on this home.
Original Mortgage
$118,750
Outstanding Balance
$106,154
Interest Rate
2.67%
Mortgage Type
New Conventional
Estimated Equity
$97,518
Purchase Details
Closed on
Feb 1, 2010
Sold by
Garcia Ambiorix
Bought by
Benitez Milagros
Home Financials for this Owner
Home Financials are based on the most recent Mortgage that was taken out on this home.
Original Mortgage
$52,500
Interest Rate
5.05%
Mortgage Type
New Conventional
Purchase Details
Closed on
Nov 22, 2002
Sold by
Fritch Richard W and Fritch Ruthann
Bought by
Garcia Ambriorix and Lucas Francisca
Home Financials for this Owner
Home Financials are based on the most recent Mortgage that was taken out on this home.
Original Mortgage
$23,400
Interest Rate
6.17%
Mortgage Type
Purchase Money Mortgage
Create a Home Valuation Report for This Property
The Home Valuation Report is an in-depth analysis detailing your home's value as well as a comparison with similar homes in the area
Home Values in the Area
Average Home Value in this Area
Purchase History
| Date | Buyer | Sale Price | Title Company |
|---|---|---|---|
| Bencosme Jose V Angeles | $125,000 | First United Land Transfer I | |
| Benitez Milagros | $70,000 | -- | |
| Garcia Ambriorix | $26,000 | -- |
Source: Public Records
Mortgage History
| Date | Status | Borrower | Loan Amount |
|---|---|---|---|
| Open | Bencosme Jose V Angeles | $118,750 | |
| Previous Owner | Benitez Milagros | $52,500 | |
| Previous Owner | Garcia Ambriorix | $23,400 |
Source: Public Records
Tax History Compared to Growth
Tax History
| Year | Tax Paid | Tax Assessment Tax Assessment Total Assessment is a certain percentage of the fair market value that is determined by local assessors to be the total taxable value of land and additions on the property. | Land | Improvement |
|---|---|---|---|---|
| 2025 | $2,094 | $64,600 | $5,200 | $59,400 |
| 2024 | $2,094 | $64,600 | $5,200 | $59,400 |
| 2023 | $2,094 | $64,600 | $5,200 | $59,400 |
| 2022 | $2,020 | $64,600 | $59,400 | $5,200 |
| 2021 | $1,980 | $64,600 | $5,200 | $59,400 |
| 2020 | $1,928 | $64,600 | $5,200 | $59,400 |
| 2019 | $1,897 | $64,600 | $5,200 | $59,400 |
| 2018 | $1,771 | $64,600 | $5,200 | $59,400 |
| 2017 | $1,726 | $64,600 | $5,200 | $59,400 |
| 2016 | -- | $64,600 | $5,200 | $59,400 |
| 2015 | -- | $64,600 | $5,200 | $59,400 |
| 2014 | -- | $64,600 | $5,200 | $59,400 |
Source: Public Records
Map
Nearby Homes
- 726 N Fountain St
- 823 W Tilghman St
- 739 N Hazel St
- 917 W Washington St
- 1010 W Tilghman St
- 746 N 10th St
- 816 W Allen St
- 622 N Silk St
- 612 N 10th St
- 516 N Lumber St
- 1038 W Green St
- 515 N Lumber St Unit 3
- 514 N Hazel St
- 719 N 11th St
- 719 1/2 N 11th St
- 753 W Cedar St
- 753 N 11th St
- 1042 W Allen St
- 513 N Howard St
- 737 W Liberty St