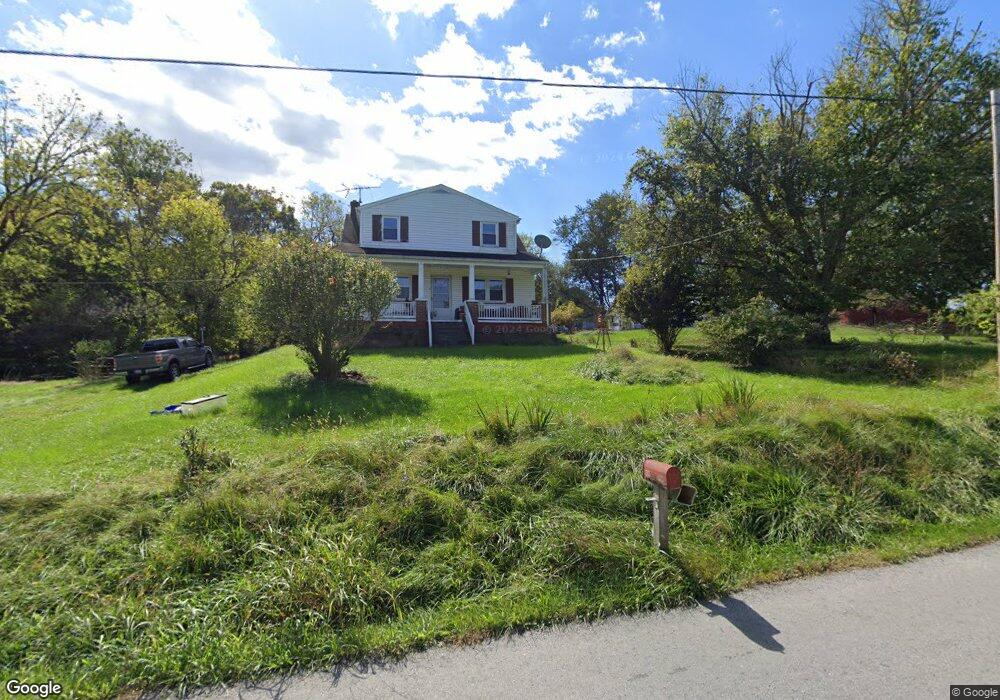
637 Persimmon Ln Shepherdstown, WV 25443
Estimated Value: $184,000 - $509,000
--
Bed
3
Baths
1,880
Sq Ft
$179/Sq Ft
Est. Value
About This Home
This home is located at 637 Persimmon Ln, Shepherdstown, WV 25443 and is currently estimated at $335,943, approximately $178 per square foot. 637 Persimmon Ln is a home located in Jefferson County with nearby schools including Shepherdstown Elementary School, Shepherdstown Middle School, and Jefferson High School.
Ownership History
Date
Name
Owned For
Owner Type
Purchase Details
Closed on
Aug 25, 2025
Sold by
Terra Abstract Trustee West Virginia Inc
Bought by
Everhart Investments Llc
Current Estimated Value
Home Financials for this Owner
Home Financials are based on the most recent Mortgage that was taken out on this home.
Original Mortgage
$283,901
Outstanding Balance
$283,901
Interest Rate
6.72%
Mortgage Type
New Conventional
Estimated Equity
$52,042
Purchase Details
Closed on
Apr 30, 2020
Sold by
Mcneal Alva L and Mcneal Nedri E
Bought by
Mcneal Alva L and Mcneal Nedri E
Home Financials for this Owner
Home Financials are based on the most recent Mortgage that was taken out on this home.
Original Mortgage
$412,500
Interest Rate
3.19%
Mortgage Type
Reverse Mortgage Home Equity Conversion Mortgage
Create a Home Valuation Report for This Property
The Home Valuation Report is an in-depth analysis detailing your home's value as well as a comparison with similar homes in the area
Home Values in the Area
Average Home Value in this Area
Purchase History
| Date | Buyer | Sale Price | Title Company |
|---|---|---|---|
| Everhart Investments Llc | $185,001 | None Listed On Document | |
| Everhart Investments Llc | $185,001 | None Listed On Document | |
| Mcneal Alva L | -- | Mortgage Information Svcs In |
Source: Public Records
Mortgage History
| Date | Status | Borrower | Loan Amount |
|---|---|---|---|
| Open | Everhart Investments Llc | $283,901 | |
| Previous Owner | Mcneal Alva L | $412,500 |
Source: Public Records
Tax History
| Year | Tax Paid | Tax Assessment Tax Assessment Total Assessment is a certain percentage of the fair market value that is determined by local assessors to be the total taxable value of land and additions on the property. | Land | Improvement |
|---|---|---|---|---|
| 2025 | $2,068 | $198,000 | $92,200 | $105,800 |
| 2024 | $1,991 | $190,100 | $92,200 | $97,900 |
| 2023 | $1,987 | $190,100 | $92,200 | $97,900 |
| 2022 | $1,662 | $159,500 | $74,200 | $85,300 |
| 2021 | $1,586 | $150,600 | $74,200 | $76,400 |
| 2020 | $1,409 | $143,800 | $66,500 | $77,300 |
| 2019 | $1,443 | $144,400 | $66,500 | $77,900 |
| 2018 | $1,390 | $138,300 | $61,400 | $76,900 |
| 2017 | $1,360 | $135,800 | $58,900 | $76,900 |
| 2016 | $1,304 | $131,300 | $53,500 | $77,800 |
| 2015 | $1,259 | $126,900 | $53,500 | $73,400 |
| 2014 | $1,277 | $128,600 | $53,500 | $75,100 |
Source: Public Records
Map
Nearby Homes
- 23 Green Meadow Cir
- 48 Field Crest Ct
- 160 Otter Run Place
- 1196 Van Clevesville Rd
- 510 Spring Warbler Way
- LOT# 2 Winebrenner Rd
- 0 Ridge Rd Unit WVJF2020954
- 150 Morgana Dr
- 224 Spring Warbler Way
- 60 Horner Farm Ln
- 778 Kearneysville Pike
- Lot 4 White Rock Rd
- Lot 221 Valor Ln
- Unnumbered Lot Ledge Shepherd Ln
- Lot 188 Valor Ln
- Lot 189 Valor Ln
- Lot 271 Valor Ln
- 333 Valor Ln
- 283 Valor Ln
- 227 Valor Ln
- 23 Persimmon Knoll
- 0 Persimmon Ln Unit JF10144224
- 50 Persimmon Ln
- 0 Persimmon Unit 1006794520
- 0 Persimmon Unit 1006559366
- 0 Persimmon Unit WVJF140712
- 0 Persimmon Unit WVJF132316
- 0 Persimmon Unit 1000217819
- 0 Persimmon Unit 1003751558
- 77 Muzzey Rd
- 50 Lamar Ln
- 600 Persimmon Ln
- Lot 3 Muzzey Rd
- 77 Persimmon Knoll
- 107 Muzzey Rd
- 541 Persimmon Ln
- 193 Muzzey Rd
- 501 Persimmon Ln
- 58 Persimmon Knoll
- 118 Muzzey Rd
Your Personal Tour Guide
Ask me questions while you tour the home.