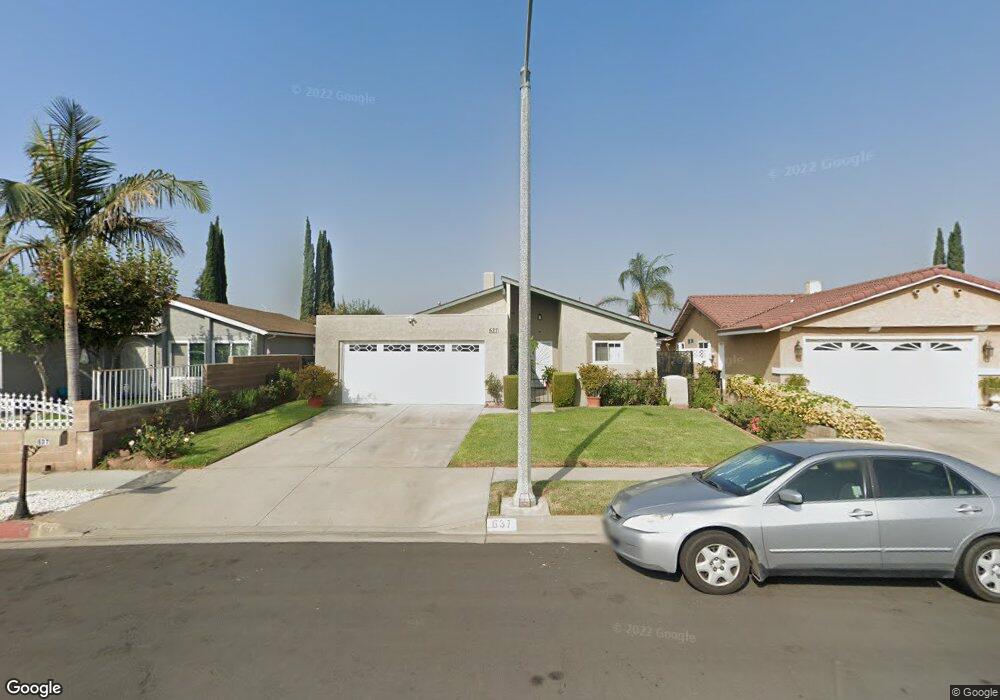
637 S Sally Lee St Azusa, CA 91702
South Azusa NeighborhoodEstimated Value: $723,000 - $765,000
4
Beds
2
Baths
1,513
Sq Ft
$496/Sq Ft
Est. Value
About This Home
This home is located at 637 S Sally Lee St, Azusa, CA 91702 and is currently estimated at $750,973, approximately $496 per square foot. 637 S Sally Lee St is a home located in Los Angeles County with nearby schools including Valleydale Elementary School, Gladstone High School, and Center Middle School.
Ownership History
Date
Name
Owned For
Owner Type
Purchase Details
Closed on
Apr 13, 2010
Sold by
Federal National Mortgage Association
Bought by
Hsbc Mortgage Corporation
Current Estimated Value
Purchase Details
Closed on
Oct 6, 2004
Sold by
Tayag Maria Luisa H and Ledesma Ariel
Bought by
Tayag Maria Luisa H and Ledesma Edwin N
Home Financials for this Owner
Home Financials are based on the most recent Mortgage that was taken out on this home.
Original Mortgage
$210,000
Interest Rate
5.72%
Mortgage Type
New Conventional
Purchase Details
Closed on
Mar 2, 1998
Sold by
Federal National Mortgage Association
Bought by
Tayag Maria Luisa H and Ledesma Ariel
Home Financials for this Owner
Home Financials are based on the most recent Mortgage that was taken out on this home.
Original Mortgage
$159,173
Interest Rate
7%
Mortgage Type
FHA
Purchase Details
Closed on
Nov 20, 1997
Sold by
Salamanca Marianito T and Federal National Mortgage Asso
Bought by
Federal National Mortgage Association
Create a Home Valuation Report for This Property
The Home Valuation Report is an in-depth analysis detailing your home's value as well as a comparison with similar homes in the area
Home Values in the Area
Average Home Value in this Area
Purchase History
| Date | Buyer | Sale Price | Title Company |
|---|---|---|---|
| Hsbc Mortgage Corporation | -- | Integrated Title Inc | |
| Tayag Maria Luisa H | -- | Landsafe Title | |
| Tayag Maria Luisa H | $162,500 | Chicago Title Co | |
| Federal National Mortgage Association | $148,382 | Landsafe Title |
Source: Public Records
Mortgage History
| Date | Status | Borrower | Loan Amount |
|---|---|---|---|
| Previous Owner | Tayag Maria Luisa H | $210,000 | |
| Previous Owner | Tayag Maria Luisa H | $159,173 |
Source: Public Records
Tax History Compared to Growth
Tax History
| Year | Tax Paid | Tax Assessment Tax Assessment Total Assessment is a certain percentage of the fair market value that is determined by local assessors to be the total taxable value of land and additions on the property. | Land | Improvement |
|---|---|---|---|---|
| 2025 | $4,957 | $393,156 | $263,360 | $129,796 |
| 2024 | $4,957 | $385,448 | $258,197 | $127,251 |
| 2023 | $4,813 | $377,891 | $253,135 | $124,756 |
| 2022 | $4,753 | $370,482 | $248,172 | $122,310 |
| 2021 | $4,632 | $363,218 | $243,306 | $119,912 |
| 2020 | $4,544 | $359,495 | $240,812 | $118,683 |
| 2019 | $4,481 | $352,447 | $236,091 | $116,356 |
| 2018 | $4,265 | $345,537 | $231,462 | $114,075 |
| 2017 | $4,210 | $338,763 | $226,924 | $111,839 |
| 2016 | $4,107 | $332,122 | $222,475 | $109,647 |
| 2015 | $4,056 | $327,134 | $219,134 | $108,000 |
| 2014 | $3,789 | $320,727 | $214,842 | $105,885 |
Source: Public Records
Map
Nearby Homes
- 717 S Azusa Ave Unit C
- 713 S Azusa Ave Unit A
- 707 S Azusa Ave Unit B
- 17139 E Newburgh St
- 760 S Azusa Ave Unit G
- 5347 N Banewell Ave
- 17049 E Orkney St
- 415 S Grandin Ave
- 890 E Gladstone St
- 11 N San Gabriel Canyon Ave
- 495 Andrew Dr Unit G
- 5527 N Gareloch Ave
- 5216 N Roxburgh Ave
- 433 E Mason St
- 543 E Arrow Hwy Unit 16
- 17141 E Tudor St
- 5246 N Clydebank Ave
- 821 S Cerritos Ave Unit 13
- 18018 E Ghent St
- 1348 N Armel Dr
- 619 S Sally Lee St
- 655 S Sally Lee St
- 232 W Kirkwall Rd
- 673 S Sally Lee St
- 216 W Susanne Marie Ct
- 233 W Kirkwall Rd
- 234 W Susanne Marie Ct
- 240 W Kirkwall Rd
- 618 S Sally Lee St
- 235 W Renwick Rd
- 691 S Sally Lee St
- 636 S Sally Lee St
- 241 W Kirkwall Rd
- 252 W Susanne Marie Ct
- 243 W Renwick Rd
- 191 W Renwick Rd
- 600 S Sally Lee St
- 248 W Kirkwall Rd
- 251 W Renwick Rd
- 249 W Kirkwall Rd