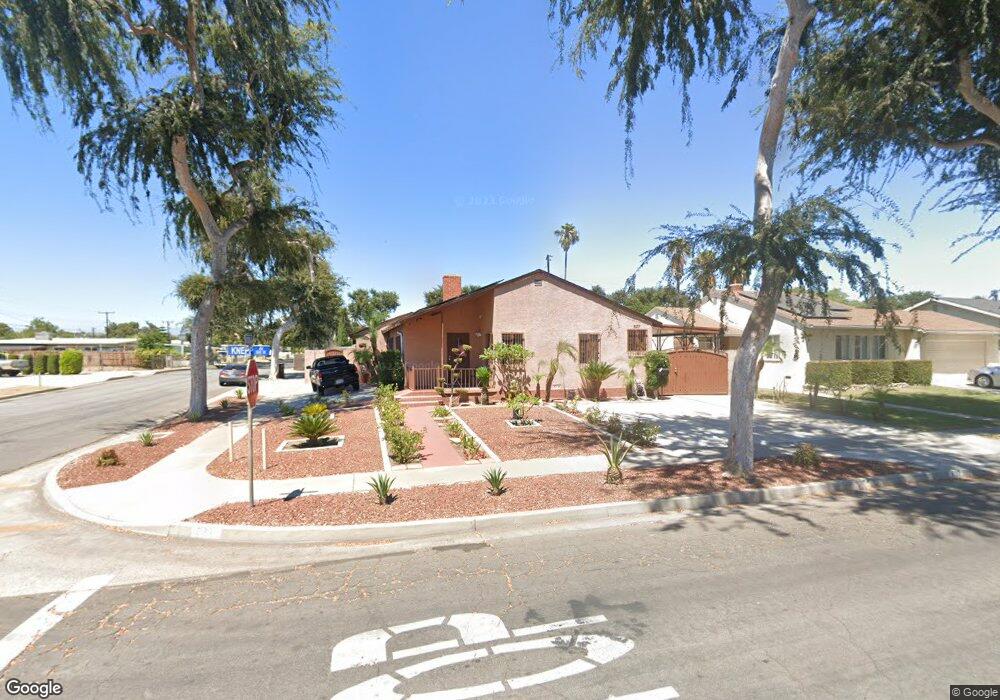
637 W Knepp Ave Fullerton, CA 92832
Estimated Value: $812,000 - $901,000
3
Beds
2
Baths
1,208
Sq Ft
$703/Sq Ft
Est. Value
About This Home
This home is located at 637 W Knepp Ave, Fullerton, CA 92832 and is currently estimated at $849,655, approximately $703 per square foot. 637 W Knepp Ave is a home located in Orange County with nearby schools including Richman Elementary School, Nicolas Junior High School, and Fullerton Union High School.
Ownership History
Date
Name
Owned For
Owner Type
Purchase Details
Closed on
Aug 29, 2018
Sold by
Chang Bonnie Diep
Bought by
Chang Bonnie Diep and Boone Chang Family Trust
Current Estimated Value
Purchase Details
Closed on
May 7, 2005
Sold by
Chang William and Chang Bonnie Diep
Bought by
Chang William and Chang Bonnie Diep
Create a Home Valuation Report for This Property
The Home Valuation Report is an in-depth analysis detailing your home's value as well as a comparison with similar homes in the area
Purchase History
We collect this data history from publicly available records. To have your information removed, we recommend requesting removal directly through your county’s website.
| Date | Buyer | Sale Price | Title Company |
|---|---|---|---|
| Chang Bonnie Diep | -- | None Available | |
| Chang Bonnie Diep | -- | None Available | |
| Chang William | -- | None Available | |
| Chang William | -- | -- |
Source: Public Records
Tax History
| Year | Tax Paid | Tax Assessment Tax Assessment Total Assessment is a certain percentage of the fair market value that is determined by local assessors to be the total taxable value of land and additions on the property. | Land | Improvement |
|---|---|---|---|---|
| 2025 | $2,738 | $231,445 | $157,153 | $74,292 |
| 2024 | $2,738 | $226,907 | $154,071 | $72,836 |
| 2023 | $2,668 | $222,458 | $151,050 | $71,408 |
| 2022 | $2,644 | $218,097 | $148,089 | $70,008 |
| 2021 | $2,598 | $213,821 | $145,185 | $68,636 |
| 2020 | $2,582 | $211,629 | $143,696 | $67,933 |
| 2019 | $2,519 | $207,480 | $140,879 | $66,601 |
| 2018 | $2,480 | $203,412 | $138,116 | $65,296 |
| 2017 | $2,438 | $199,424 | $135,408 | $64,016 |
| 2016 | $2,388 | $195,514 | $132,753 | $62,761 |
| 2015 | $2,323 | $192,578 | $130,759 | $61,819 |
| 2014 | $2,257 | $188,806 | $128,197 | $60,609 |
Source: Public Records
Map
Nearby Homes
- 506 W Rosslynn Ave
- 460 W Knepp Ave
- 618 W Orangethorpe Ave
- 517 S Richman Ave
- 708 S Orange Ave
- 401 W Southgate Ave
- 1041 Lime Tree Place
- 1370 Clementine Way
- 306 W Porter Ave
- 1108 Williamson Ave
- 443 W Houston Ave
- 1201 W Valencia Dr Unit 77
- 1201 W Valencia Dr Unit 120
- 1201 W Valencia Dr Unit 18
- 1500 S Lovering Ave
- 1507 S Citrus Ave
- 1300 W Valencia Dr
- 308 Drake Ave
- 301 N Ford Ave
- 1006 S Lambert Dr
- 631 W Knepp Ave
- 625 W Knepp Ave
- 636 W Rosslynn Ave
- 636 W Knepp Ave
- 630 W Knepp Ave
- 630 W Rosslynn Ave
- 621 W Knepp Ave
- 901 S Woods Ave
- 624 W Knepp Ave
- 624 W Rosslynn Ave
- 709 W Knepp Ave
- 801 S Woods Ave
- 620 W Knepp Ave
- 620 W Rosslynn Ave
- 905 S Woods Ave
- 617 W Knepp Ave
- 637 W Southgate Ave
- 631 W Southgate Ave
- 900 S Washington Ave
- 715 W Knepp Ave
Your Personal Tour Guide
Ask me questions while you tour the home.