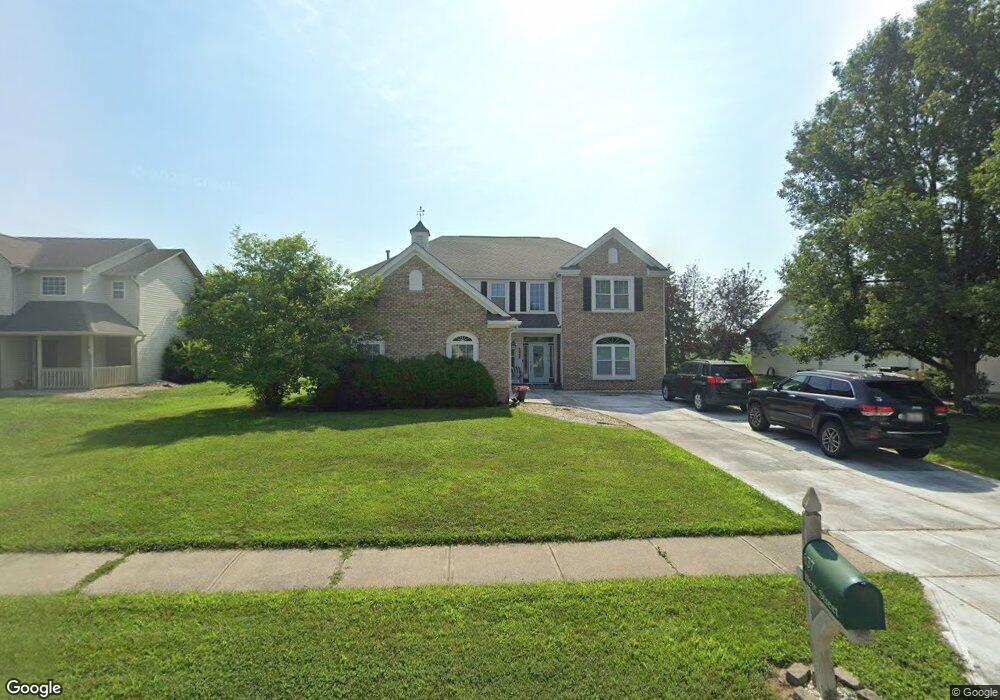
637 West St Whiteland, IN 46184
Estimated Value: $340,000 - $381,000
4
Beds
3
Baths
3,352
Sq Ft
$108/Sq Ft
Est. Value
About This Home
This home is located at 637 West St, Whiteland, IN 46184 and is currently estimated at $362,980, approximately $108 per square foot. 637 West St is a home located in Johnson County with nearby schools including Whiteland Elementary School, Clark-Pleasant Middle School, and Whiteland Community High School.
Ownership History
Date
Name
Owned For
Owner Type
Purchase Details
Closed on
Jul 1, 2008
Sold by
Jv Enterprises Llc
Bought by
Lukich Brian C and Lukich Bridget R
Current Estimated Value
Home Financials for this Owner
Home Financials are based on the most recent Mortgage that was taken out on this home.
Original Mortgage
$134,400
Outstanding Balance
$80,118
Interest Rate
4.62%
Mortgage Type
Adjustable Rate Mortgage/ARM
Estimated Equity
$282,862
Purchase Details
Closed on
Mar 20, 2008
Sold by
Bertram Todd R and Bertram Brandy L
Bought by
J V Enterprises Llc
Create a Home Valuation Report for This Property
The Home Valuation Report is an in-depth analysis detailing your home's value as well as a comparison with similar homes in the area
Home Values in the Area
Average Home Value in this Area
Purchase History
| Date | Buyer | Sale Price | Title Company |
|---|---|---|---|
| Lukich Brian C | -- | Fat | |
| J V Enterprises Llc | $122,100 | None Available |
Source: Public Records
Mortgage History
| Date | Status | Borrower | Loan Amount |
|---|---|---|---|
| Open | Lukich Brian C | $134,400 |
Source: Public Records
Tax History Compared to Growth
Tax History
| Year | Tax Paid | Tax Assessment Tax Assessment Total Assessment is a certain percentage of the fair market value that is determined by local assessors to be the total taxable value of land and additions on the property. | Land | Improvement |
|---|---|---|---|---|
| 2025 | $3,195 | $326,600 | $55,000 | $271,600 |
| 2024 | $3,195 | $305,200 | $55,000 | $250,200 |
| 2023 | $3,251 | $311,600 | $55,000 | $256,600 |
| 2022 | $3,026 | $290,300 | $43,300 | $247,000 |
| 2021 | $2,376 | $227,400 | $43,300 | $184,100 |
| 2020 | $2,381 | $226,400 | $43,300 | $183,100 |
| 2019 | $2,172 | $206,800 | $34,700 | $172,100 |
| 2018 | $2,308 | $219,500 | $20,500 | $199,000 |
| 2017 | $2,066 | $206,600 | $20,500 | $186,100 |
| 2016 | $1,905 | $185,400 | $20,500 | $164,900 |
| 2014 | $1,800 | $180,000 | $26,800 | $153,200 |
| 2013 | $1,800 | $166,200 | $26,800 | $139,400 |
Source: Public Records
Map
Nearby Homes