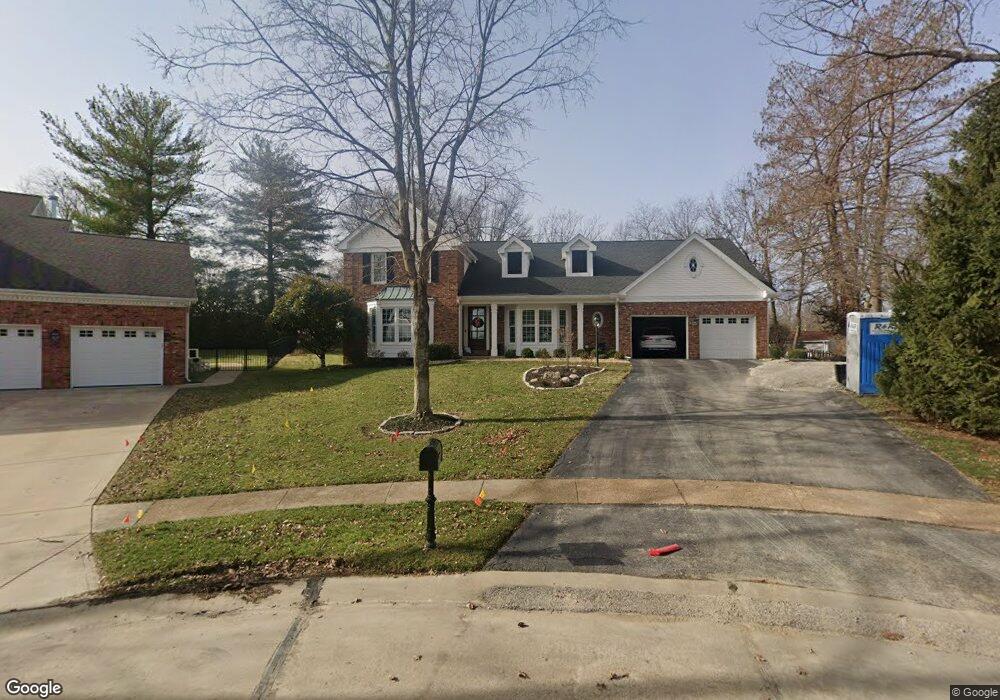
637 Westledge Ct Saint Louis, MO 63131
Estimated Value: $841,967 - $971,000
5
Beds
4
Baths
3,400
Sq Ft
$260/Sq Ft
Est. Value
About This Home
This home is located at 637 Westledge Ct, Saint Louis, MO 63131 and is currently estimated at $882,992, approximately $259 per square foot. 637 Westledge Ct is a home located in St. Louis County with nearby schools including Barretts Elementary School, Parkway South Middle School, and Parkway South High School.
Ownership History
Date
Name
Owned For
Owner Type
Purchase Details
Closed on
Dec 29, 2020
Sold by
Blankemeyer Christopher and Blankemeyer Caroline
Bought by
Blankemeyer Christopher R and Blankemeyer Caroline B
Current Estimated Value
Purchase Details
Closed on
Jun 6, 2008
Sold by
Eggers Mark F and Eggers Linda
Bought by
Blankemeyer Christopher and Blankemeyer Caroline
Home Financials for this Owner
Home Financials are based on the most recent Mortgage that was taken out on this home.
Original Mortgage
$105,000
Interest Rate
5.99%
Mortgage Type
Credit Line Revolving
Purchase Details
Closed on
Sep 27, 2001
Sold by
Sinks Thomas G and Sinks Christine R
Bought by
Eggers Mark F and Eggers Linda
Home Financials for this Owner
Home Financials are based on the most recent Mortgage that was taken out on this home.
Original Mortgage
$260,000
Interest Rate
6.88%
Mortgage Type
Balloon
Create a Home Valuation Report for This Property
The Home Valuation Report is an in-depth analysis detailing your home's value as well as a comparison with similar homes in the area
Home Values in the Area
Average Home Value in this Area
Purchase History
| Date | Buyer | Sale Price | Title Company |
|---|---|---|---|
| Blankemeyer Christopher R | -- | None Available | |
| Blankemeyer Christopher | $620,000 | Ust | |
| Eggers Mark F | $479,900 | -- |
Source: Public Records
Mortgage History
| Date | Status | Borrower | Loan Amount |
|---|---|---|---|
| Closed | Blankemeyer Christopher | $105,000 | |
| Open | Blankemeyer Christopher | $417,000 | |
| Previous Owner | Eggers Mark F | $260,000 |
Source: Public Records
Tax History Compared to Growth
Tax History
| Year | Tax Paid | Tax Assessment Tax Assessment Total Assessment is a certain percentage of the fair market value that is determined by local assessors to be the total taxable value of land and additions on the property. | Land | Improvement |
|---|---|---|---|---|
| 2025 | $7,143 | $160,610 | $80,790 | $79,820 |
| 2024 | $7,143 | $127,340 | $44,420 | $82,920 |
| 2023 | $7,039 | $127,340 | $44,420 | $82,920 |
| 2022 | $6,905 | $113,510 | $48,470 | $65,040 |
| 2021 | $6,848 | $113,510 | $48,470 | $65,040 |
| 2020 | $6,404 | $101,480 | $38,740 | $62,740 |
| 2019 | $6,315 | $101,480 | $38,740 | $62,740 |
| 2018 | $6,090 | $90,460 | $31,030 | $59,430 |
| 2017 | $6,008 | $90,460 | $31,030 | $59,430 |
| 2016 | $6,254 | $89,530 | $27,230 | $62,300 |
| 2015 | $6,590 | $89,530 | $27,230 | $62,300 |
| 2014 | $6,143 | $90,630 | $33,710 | $56,920 |
Source: Public Records
Map
Nearby Homes
- 12819 Huntercreek Rd
- 13124 Huntercreek Ridge Rd
- 13156 Dougherty Ridge Ct
- 9 Enclave Dr
- 11 Enclave Dr
- 2300 E Royal Ct
- 4 Enclave Dr
- 2 Enclave Dr
- 2405 Fairoyal Dr
- 467 Tree Top Ln
- 1848 Ridgeview Circle Dr
- 2145 Trailcrest Dr
- 591-593 N Ballas Rd
- 1878 Ridgeview Circle Dr
- 13385 Hiddendale Ln Unit 93
- 310 Greenbriar Estates Dr
- 2211 Viewroyal Dr
- 12213 Brook Springs Ct
- 2033 Woodland Knoll
- 698 Trailcrest Ct Unit 5
- 641 Westledge Ct
- 633 Westledge Ct
- 12931 Huntercreek Rd
- 12923 Huntercreek Rd
- 544 Winding Trail Ln
- 550 Winding Trail Ln
- 532 Winding Trail Ln
- 627 Westledge Ct
- 12915 Huntercreek Rd
- 645 Westledge Ct
- 12909 Huntercreek Rd
- 628 Westledge Ct
- 623 Westledge Ct
- 556 Winding Trail Ln
- 545 Winding Trail Ln
- 12934 Huntercreek Rd
- 12922 Huntercreek Rd
- 12850 Westledge Ln
- 12953 Huntercreek Rd
- 551 Winding Trail Ln