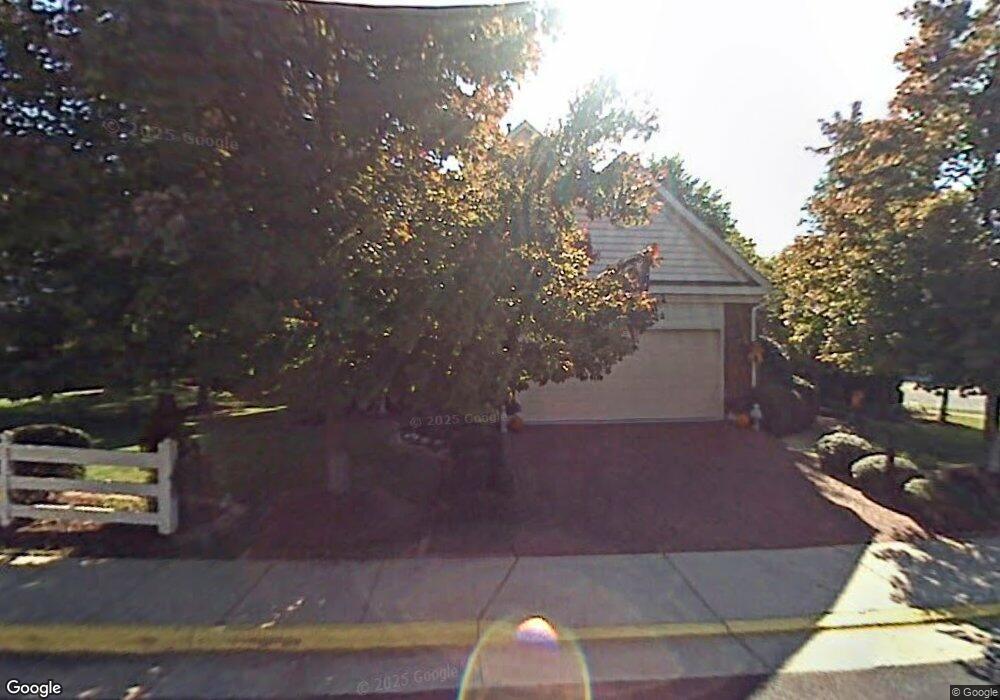
6371 Alderman Dr Alexandria, VA 22315
Estimated Value: $966,000 - $1,014,000
4
Beds
4
Baths
4,006
Sq Ft
$246/Sq Ft
Est. Value
About This Home
This home is located at 6371 Alderman Dr, Alexandria, VA 22315 and is currently estimated at $985,441, approximately $245 per square foot. 6371 Alderman Dr is a home located in Fairfax County with nearby schools including Lane Elementary School, Hayfield Secondary School, and Calvary Road Christian School & Preschool.
Ownership History
Date
Name
Owned For
Owner Type
Purchase Details
Closed on
Sep 23, 2021
Sold by
Blochberger Sean and Blochberger Aurora
Bought by
Blochberger Sean Charles and Blochberger Aurora Gay
Current Estimated Value
Purchase Details
Closed on
May 12, 2011
Sold by
Moore Trustee Barbara K
Bought by
Blochberger Sean
Home Financials for this Owner
Home Financials are based on the most recent Mortgage that was taken out on this home.
Original Mortgage
$663,702
Outstanding Balance
$461,242
Interest Rate
4.88%
Mortgage Type
VA
Estimated Equity
$524,199
Purchase Details
Closed on
May 29, 1996
Sold by
Amherst Village Lc
Bought by
Moore Robert
Home Financials for this Owner
Home Financials are based on the most recent Mortgage that was taken out on this home.
Original Mortgage
$110,000
Interest Rate
7.91%
Purchase Details
Closed on
Mar 7, 1996
Sold by
Section 3 Kingstowne Lc
Bought by
Amherst Village Lc
Create a Home Valuation Report for This Property
The Home Valuation Report is an in-depth analysis detailing your home's value as well as a comparison with similar homes in the area
Home Values in the Area
Average Home Value in this Area
Purchase History
| Date | Buyer | Sale Price | Title Company |
|---|---|---|---|
| Blochberger Sean Charles | -- | None Available | |
| Blochberger Sean | $642,500 | -- | |
| Moore Robert | $338,863 | -- | |
| Amherst Village Lc | $237,000 | -- | |
| Section 3 Kingstowne Lc | $158,001 | -- |
Source: Public Records
Mortgage History
| Date | Status | Borrower | Loan Amount |
|---|---|---|---|
| Open | Blochberger Sean | $663,702 | |
| Previous Owner | Section 3 Kingstowne Lc | $110,000 |
Source: Public Records
Tax History Compared to Growth
Tax History
| Year | Tax Paid | Tax Assessment Tax Assessment Total Assessment is a certain percentage of the fair market value that is determined by local assessors to be the total taxable value of land and additions on the property. | Land | Improvement |
|---|---|---|---|---|
| 2025 | $9,496 | $893,620 | $337,000 | $556,620 |
| 2024 | $9,496 | $819,660 | $309,000 | $510,660 |
| 2023 | $9,250 | $819,660 | $309,000 | $510,660 |
| 2022 | $8,586 | $750,830 | $278,000 | $472,830 |
| 2021 | $8,545 | $728,150 | $260,000 | $468,150 |
| 2020 | $8,024 | $677,990 | $260,000 | $417,990 |
| 2019 | $8,024 | $677,990 | $260,000 | $417,990 |
| 2018 | $7,497 | $651,910 | $250,000 | $401,910 |
| 2017 | $7,230 | $622,770 | $240,000 | $382,770 |
| 2016 | $7,070 | $610,260 | $235,000 | $375,260 |
| 2015 | $7,245 | $649,210 | $250,000 | $399,210 |
| 2014 | $6,628 | $595,250 | $229,000 | $366,250 |
Source: Public Records
Map
Nearby Homes
- 6416 Caleb Ct
- 6412 Caleb Ct
- 6338 Alderman Dr
- 7720 Stone Wheat Ct
- 7711 Beulah St
- 6570 Osprey Point Ln
- 6605 Thomas Grant Ct
- 7755 Effingham Square
- 6604 Netties Ln Unit 1204
- 7749 Effingham Square
- 6602 Thackwell Way Unit C
- 6602 Patent Parish Ln
- 6622 Patent Parish Ln
- 6623 Patent Parish Ln
- 6258 Walkers Croft Way
- 6611 Netties Ln Unit 24L
- 7708B Haynes Point Way Unit 9B
- 7826 Desiree St
- 6331 Steinway St
- 6635 Creek Point Way
- 6361 Alderman Dr
- 6357 Alderman Dr
- 6355 Alderman Dr
- 6366 Alderman Dr
- 6360 Alderman Dr
- 6368 Alderman Dr
- 6351 Alderman Dr
- 6358 Alderman Dr
- 6353 Alderman Dr
- 7651 Shuttington Dr
- 6374 Alderman Dr
- 6422 Caleb Ct
- 6349 Alderman Dr
- 6364 Alderman Dr
- 6352 Alderman Dr
- 6362 Alderman Dr
- 6470 Warwick Cir
- 6370 Alderman Dr
- 7653 Shuttington Dr
- 6376 Alderman Dr