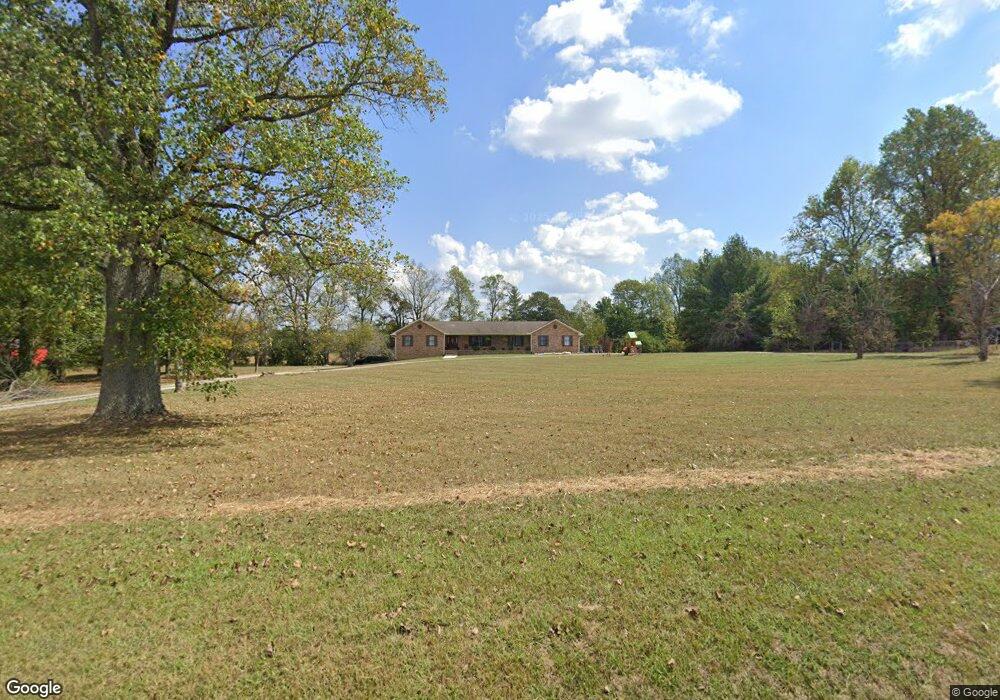
6377 Hilham Rd Cookeville, TN 38506
Estimated Value: $496,783 - $658,000
--
Bed
3
Baths
3,083
Sq Ft
$195/Sq Ft
Est. Value
About This Home
This home is located at 6377 Hilham Rd, Cookeville, TN 38506 and is currently estimated at $599,696, approximately $194 per square foot. 6377 Hilham Rd is a home located in Putnam County with nearby schools including Cookeville High School, Algood Middle School, and Algood Elementary School.
Ownership History
Date
Name
Owned For
Owner Type
Purchase Details
Closed on
Mar 18, 2021
Sold by
Dogwood Acres Partners
Bought by
Lovell Carole W
Current Estimated Value
Purchase Details
Closed on
Jan 15, 2015
Sold by
Phillips Roy Guy
Bought by
Dogwood Acres Partners
Purchase Details
Closed on
Dec 1, 2014
Sold by
Phillips Roy Guy
Bought by
Dogwood Acres Partners Gp
Purchase Details
Closed on
May 9, 1994
Bought by
Phillips Roy Guy and Phillips Thelma Jean
Purchase Details
Closed on
Aug 22, 1988
Bought by
Phillips Roy Guy
Create a Home Valuation Report for This Property
The Home Valuation Report is an in-depth analysis detailing your home's value as well as a comparison with similar homes in the area
Home Values in the Area
Average Home Value in this Area
Purchase History
| Date | Buyer | Sale Price | Title Company |
|---|---|---|---|
| Lovell Carole W | -- | Crawford Walter K | |
| Dogwood Acres Partners | -- | -- | |
| Dogwood Acres Partners Gp | $275,000 | -- | |
| Phillips Roy Guy | $14,000 | -- | |
| Phillips Roy Guy | -- | -- | |
| -- | $20,000 | -- |
Source: Public Records
Tax History Compared to Growth
Tax History
| Year | Tax Paid | Tax Assessment Tax Assessment Total Assessment is a certain percentage of the fair market value that is determined by local assessors to be the total taxable value of land and additions on the property. | Land | Improvement |
|---|---|---|---|---|
| 2024 | $2,171 | $81,600 | $9,450 | $72,150 |
| 2023 | $2,171 | $81,600 | $9,450 | $72,150 |
| 2022 | $2,017 | $81,600 | $9,450 | $72,150 |
| 2021 | $2,017 | $81,600 | $9,450 | $72,150 |
| 2020 | $1,840 | $81,600 | $9,450 | $72,150 |
| 2019 | $1,840 | $62,900 | $8,825 | $54,075 |
| 2018 | $1,717 | $62,900 | $8,825 | $54,075 |
| 2017 | $1,717 | $62,900 | $8,825 | $54,075 |
| 2016 | $1,717 | $62,900 | $8,825 | $54,075 |
| 2015 | $1,895 | $67,550 | $8,825 | $58,725 |
| 2014 | $1,847 | $65,836 | $0 | $0 |
Source: Public Records
Map
Nearby Homes