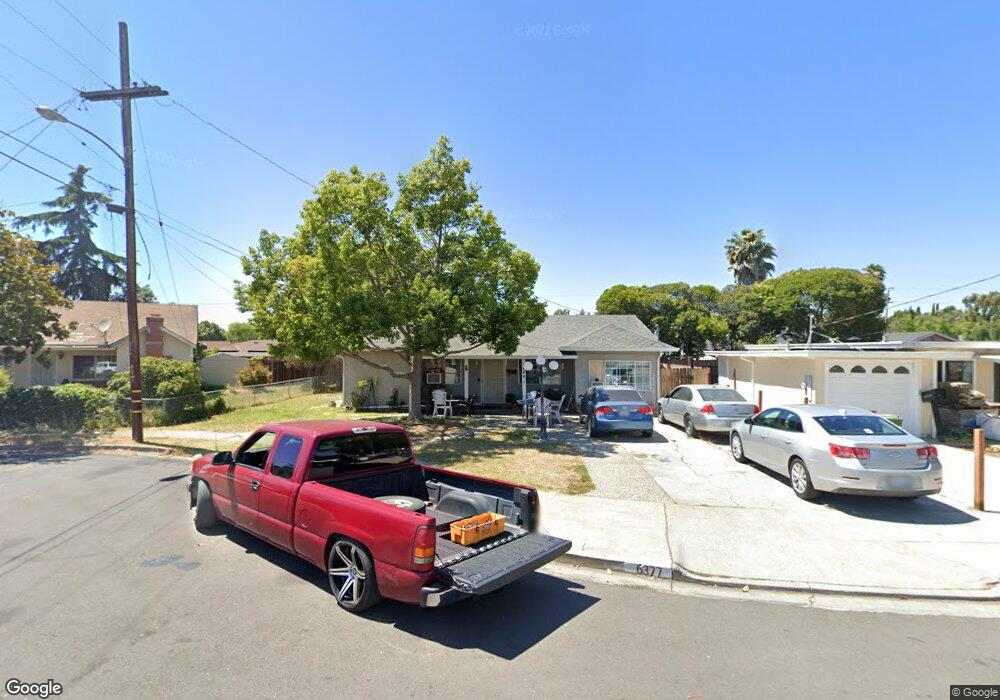
6377 Zulmida Ave Newark, CA 94560
Estimated Value: $939,000 - $1,068,000
3
Beds
1
Bath
1,322
Sq Ft
$766/Sq Ft
Est. Value
About This Home
This home is located at 6377 Zulmida Ave, Newark, CA 94560 and is currently estimated at $1,012,531, approximately $765 per square foot. 6377 Zulmida Ave is a home located in Alameda County with nearby schools including Coyote Hills Elementary School, Newark Junior High School, and Newark Memorial High School.
Ownership History
Date
Name
Owned For
Owner Type
Purchase Details
Closed on
Jan 24, 2025
Sold by
Manuel G Gamez And Belen Gamez Revocable and Gamez Belen
Bought by
Manuel G Gamez And Belen Gamez Revocable Trus and Gamez
Current Estimated Value
Home Financials for this Owner
Home Financials are based on the most recent Mortgage that was taken out on this home.
Original Mortgage
$1,395,000
Outstanding Balance
$1,386,400
Interest Rate
6.72%
Mortgage Type
Reverse Mortgage Home Equity Conversion Mortgage
Estimated Equity
-$373,869
Purchase Details
Closed on
Jul 16, 2012
Sold by
Mottram Debra Fermina
Bought by
Gamez Belen and Gamez Manuel G
Purchase Details
Closed on
Nov 10, 2011
Sold by
Gamez Belen and Gamez Manuel G
Bought by
Mottram Debra Fermina
Purchase Details
Closed on
Mar 3, 2004
Sold by
Gamez Manuel G and Gamez Belen
Bought by
Gamez Manuel G and Gamez Belen
Create a Home Valuation Report for This Property
The Home Valuation Report is an in-depth analysis detailing your home's value as well as a comparison with similar homes in the area
Home Values in the Area
Average Home Value in this Area
Purchase History
| Date | Buyer | Sale Price | Title Company |
|---|---|---|---|
| Manuel G Gamez And Belen Gamez Revocable Trus | -- | Wfg National Title Insurance C | |
| Gamez Belen | -- | None Available | |
| Mottram Debra Fermina | -- | None Available | |
| Gamez Manuel G | -- | -- |
Source: Public Records
Mortgage History
| Date | Status | Borrower | Loan Amount |
|---|---|---|---|
| Open | Manuel G Gamez And Belen Gamez Revocable Trus | $1,395,000 | |
| Closed | Manuel G Gamez And Belen Gamez Revocable Trus | $1,395,000 |
Source: Public Records
Tax History Compared to Growth
Tax History
| Year | Tax Paid | Tax Assessment Tax Assessment Total Assessment is a certain percentage of the fair market value that is determined by local assessors to be the total taxable value of land and additions on the property. | Land | Improvement |
|---|---|---|---|---|
| 2025 | $1,405 | $57,544 | $24,025 | $40,519 |
| 2024 | $1,405 | $56,279 | $23,554 | $39,725 |
| 2023 | $1,344 | $62,038 | $23,092 | $38,946 |
| 2022 | $1,295 | $53,821 | $22,639 | $38,182 |
| 2021 | $1,268 | $52,629 | $22,195 | $37,434 |
| 2020 | $1,164 | $59,018 | $21,968 | $37,050 |
| 2019 | $1,152 | $57,861 | $21,537 | $36,324 |
| 2018 | $1,127 | $56,726 | $21,115 | $35,611 |
| 2017 | $1,097 | $55,614 | $20,701 | $34,913 |
| 2016 | $1,065 | $54,524 | $20,295 | $34,229 |
| 2015 | $1,059 | $53,705 | $19,990 | $33,715 |
| 2014 | $1,022 | $52,652 | $19,598 | $33,054 |
Source: Public Records
Map
Nearby Homes
- 6416 Mayhews Landing Rd
- 36523 Cherry St
- 36593 Leone St
- 36535 Mulberry St
- 6364 Noel Ave
- 36702 Olive St
- 36466 Haley St
- 6278 Dairy Ave
- 36563 Beutke Dr
- 6125 Thornton Ave Unit A
- 36976 Mulberry St
- 36913 Newark Blvd Unit C
- 36184 Toulouse St
- 5879 Caleb Ct
- 37136 Magnolia St
- 6831 Cabernet Ave
- 6198 Civic Terrace Ave Unit A
- 37282 Magnolia St
- 36985 Walnut St
- 7843 Railroad Ave
- 6369 Zulmida Ave
- 6385 Zulmida Ave
- 6386 Mayhews Landing Rd
- 6361 Zulmida Ave
- 6374 Mayhews Landing Rd
- 6428 Mayhews Landing Rd
- 36541 Jennifer St
- 6362 Mayhews Landing Rd
- 6368 Zulmida Ave
- 6353 Zulmida Ave
- 36549 Jennifer St
- 6440 Mayhews Landing Rd
- 6350 Mayhews Landing Rd
- 36557 Jennifer St
- 36566 Jennifer St
- 6345 Zulmida Ave
- 6452 Mayhews Landing Rd
- 6352 Zulmida Ave
- 6338 Mayhews Landing Rd
- 36536 Cherry St