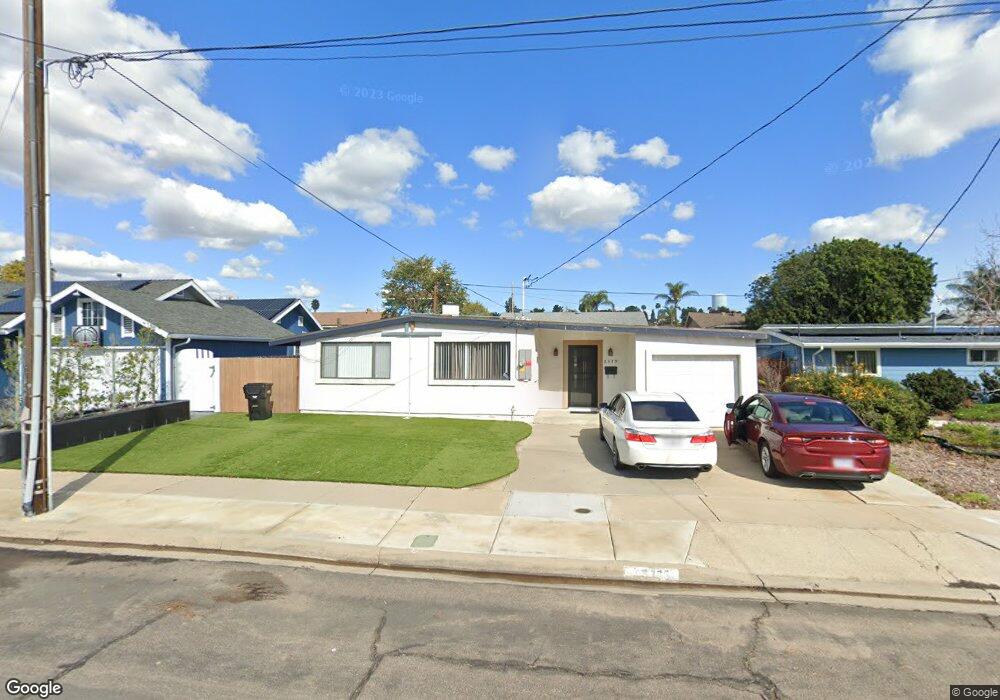
6379 Anvil Lake Ave San Diego, CA 92119
Lake Murray NeighborhoodEstimated Value: $808,776 - $955,000
3
Beds
2
Baths
1,525
Sq Ft
$585/Sq Ft
Est. Value
About This Home
This home is located at 6379 Anvil Lake Ave, San Diego, CA 92119 and is currently estimated at $892,444, approximately $585 per square foot. 6379 Anvil Lake Ave is a home located in San Diego County with nearby schools including Benchley-Weinberger Elementary, Pershing Middle School, and Patrick Henry High School.
Ownership History
Date
Name
Owned For
Owner Type
Purchase Details
Closed on
Oct 31, 2002
Sold by
Nipper Thomas and Nipper Laura L
Bought by
Nipper Thomas and Nipper Laura
Current Estimated Value
Home Financials for this Owner
Home Financials are based on the most recent Mortgage that was taken out on this home.
Original Mortgage
$190,000
Outstanding Balance
$79,172
Interest Rate
5.95%
Estimated Equity
$813,272
Purchase Details
Closed on
Aug 19, 1999
Sold by
Value T Sales Inc
Bought by
Nipper Thomas and Nipper Laura L
Home Financials for this Owner
Home Financials are based on the most recent Mortgage that was taken out on this home.
Original Mortgage
$183,600
Interest Rate
7.5%
Purchase Details
Closed on
Dec 29, 1998
Sold by
Domingo Vladimir J and Domingo Marla W
Bought by
Value T Sales Inc
Purchase Details
Closed on
Jul 20, 1998
Sold by
Domingo Vladimir J
Bought by
The Hunger Trust
Purchase Details
Closed on
Jul 28, 1989
Purchase Details
Closed on
Feb 29, 1984
Create a Home Valuation Report for This Property
The Home Valuation Report is an in-depth analysis detailing your home's value as well as a comparison with similar homes in the area
Home Values in the Area
Average Home Value in this Area
Purchase History
| Date | Buyer | Sale Price | Title Company |
|---|---|---|---|
| Nipper Thomas | -- | Commerce Title Company | |
| Nipper Thomas | $204,000 | Southland Title | |
| Value T Sales Inc | $139,988 | Northern Counties Title Co | |
| The Hunger Trust | -- | -- | |
| The Vabin Trust | -- | -- | |
| -- | $142,500 | -- | |
| -- | $76,000 | -- |
Source: Public Records
Mortgage History
| Date | Status | Borrower | Loan Amount |
|---|---|---|---|
| Open | Nipper Thomas | $190,000 | |
| Closed | Nipper Thomas | $183,600 | |
| Closed | Nipper Thomas | $30,000 |
Source: Public Records
Tax History Compared to Growth
Tax History
| Year | Tax Paid | Tax Assessment Tax Assessment Total Assessment is a certain percentage of the fair market value that is determined by local assessors to be the total taxable value of land and additions on the property. | Land | Improvement |
|---|---|---|---|---|
| 2025 | $3,785 | $313,518 | $133,001 | $180,517 |
| 2024 | $3,785 | $307,372 | $130,394 | $176,978 |
| 2023 | $3,712 | $301,346 | $127,838 | $173,508 |
| 2022 | $3,612 | $295,438 | $125,332 | $170,106 |
| 2021 | $3,585 | $289,646 | $122,875 | $166,771 |
| 2020 | $3,542 | $286,677 | $121,616 | $165,061 |
| 2019 | $3,477 | $281,057 | $119,232 | $161,825 |
| 2018 | $3,250 | $275,547 | $116,895 | $158,652 |
| 2017 | $80 | $270,145 | $114,603 | $155,542 |
| 2016 | $3,118 | $264,849 | $112,356 | $152,493 |
| 2015 | $3,071 | $260,872 | $110,669 | $150,203 |
| 2014 | $3,013 | $255,763 | $108,502 | $147,261 |
Source: Public Records
Map
Nearby Homes
- 6387 Anvil Lake Ave
- 6388 Anvil Lake Ave
- 8364 Lake Ashwood Ave
- 6285 Anvil Lake Ave
- 6252 Lake Albano Ave
- 6354 Arms Lake Ave
- 8343 San Carlos Dr
- 8649 Lake Murray Blvd Unit 4
- 6232 Lake Athabaska Place
- 6476 Jackson Dr
- 8671 Lake Murray Blvd Unit 4
- 6071 Amarillo Ave
- 8374 Lake Gaby Ave
- 6224 Rose Lake Ave
- 8765 Lake Murray Blvd Unit 3
- 8765 Lake Murray Blvd Unit 11
- 8721 Lake Murray Blvd Unit 1
- 8767 Blue Lake Dr
- 8715 Lake Murray Blvd Unit 4
- 7976 Lake Cayuga Dr
- 6371 Anvil Lake Ave
- 6384 Lake Aral Dr
- 6394 Lake Aral Dr
- 6374 Lake Aral Dr
- 6363 Anvil Lake Ave
- 6380 Anvil Lake Ave
- 6364 Lake Aral Dr
- 6370 Anvil Lake Ave
- 6355 Anvil Lake Ave
- 6360 Anvil Lake Ave
- 6354 Lake Aral Dr
- 6373 Amber Lake Ave
- 6385 Lake Aral Dr
- 6381 Amber Lake Ave
- 6375 Lake Aral Dr
- 6395 Lake Aral Dr
- 6347 Anvil Lake Ave
- 6365 Amber Lake Ave
- 6354 Anvil Lake Ave
- 6365 Lake Aral Dr