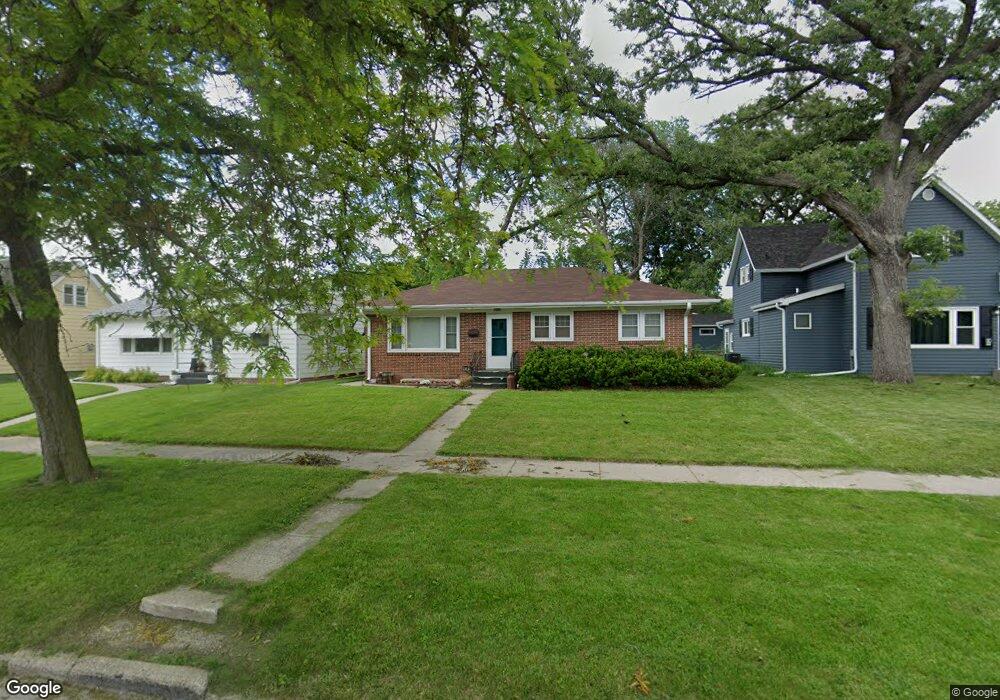
638 11th Ave N Fort Dodge, IA 50501
Estimated Value: $140,000 - $157,000
3
Beds
2
Baths
1,040
Sq Ft
$140/Sq Ft
Est. Value
About This Home
This home is located at 638 11th Ave N, Fort Dodge, IA 50501 and is currently estimated at $145,821, approximately $140 per square foot. 638 11th Ave N is a home located in Webster County with nearby schools including Feelhaver Elementary School, Fort Dodge Middle School, and Fort Dodge Senior High School.
Ownership History
Date
Name
Owned For
Owner Type
Purchase Details
Closed on
Nov 16, 2021
Sold by
Tanner Reeves
Bought by
Baughman Ricky and Baughman Brittaney
Current Estimated Value
Purchase Details
Closed on
Mar 17, 2020
Sold by
Reeves Susan Ann
Bought by
Reeves Tanner
Home Financials for this Owner
Home Financials are based on the most recent Mortgage that was taken out on this home.
Original Mortgage
$5,000
Interest Rate
3.4%
Mortgage Type
New Conventional
Purchase Details
Closed on
Nov 2, 2018
Sold by
Reebes Susan A
Bought by
Rreves Tanner
Create a Home Valuation Report for This Property
The Home Valuation Report is an in-depth analysis detailing your home's value as well as a comparison with similar homes in the area
Home Values in the Area
Average Home Value in this Area
Purchase History
| Date | Buyer | Sale Price | Title Company |
|---|---|---|---|
| Baughman Ricky | $133,000 | None Listed On Document | |
| Reeves Tanner | $100,000 | None Available | |
| Rreves Tanner | $100,000 | -- |
Source: Public Records
Mortgage History
| Date | Status | Borrower | Loan Amount |
|---|---|---|---|
| Previous Owner | Reeves Tanner | $5,000 |
Source: Public Records
Tax History Compared to Growth
Tax History
| Year | Tax Paid | Tax Assessment Tax Assessment Total Assessment is a certain percentage of the fair market value that is determined by local assessors to be the total taxable value of land and additions on the property. | Land | Improvement |
|---|---|---|---|---|
| 2025 | $2,760 | $135,360 | $10,000 | $125,360 |
| 2024 | $2,760 | $127,790 | $10,000 | $117,790 |
| 2023 | $2,874 | $127,790 | $10,000 | $117,790 |
| 2022 | $2,304 | $117,550 | $10,000 | $107,550 |
| 2021 | $2,312 | $97,290 | $10,000 | $87,290 |
| 2020 | $2,312 | $92,700 | $10,000 | $82,700 |
| 2019 | $1,866 | $85,510 | $12,100 | $73,410 |
| 2018 | $1,840 | $73,570 | $11,000 | $62,570 |
| 2017 | $1,840 | $76,490 | $0 | $0 |
| 2016 | $1,920 | $76,490 | $0 | $0 |
| 2015 | $1,920 | $76,490 | $0 | $0 |
| 2014 | $1,880 | $76,490 | $0 | $0 |
Source: Public Records
Map
Nearby Homes