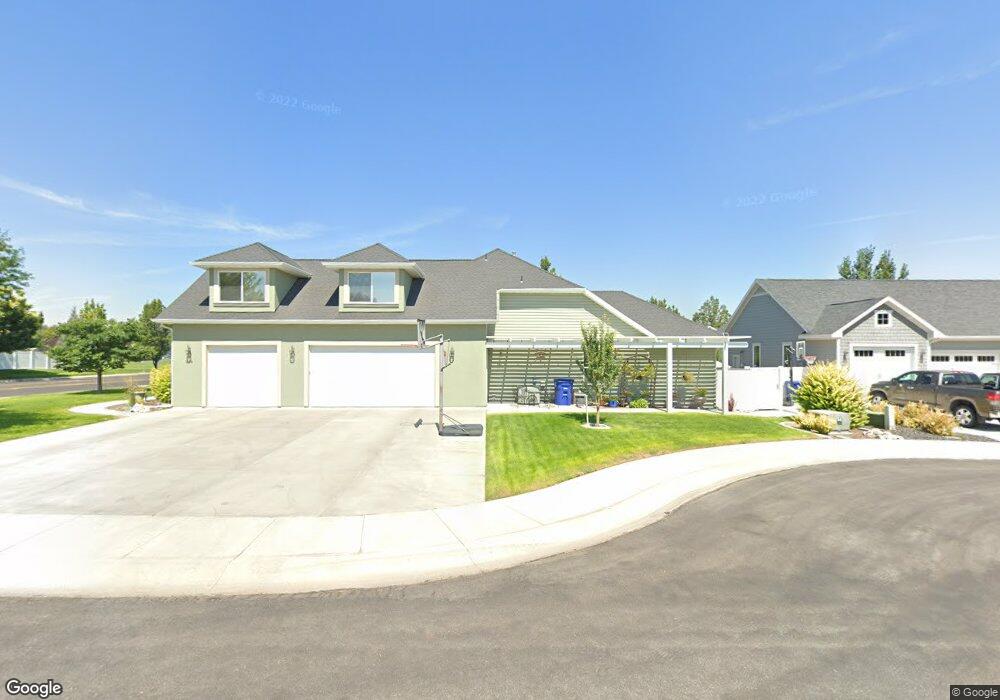
638 Carriage Ln N Twin Falls, ID 83301
Estimated Value: $580,000 - $706,000
3
Beds
3
Baths
2,746
Sq Ft
$229/Sq Ft
Est. Value
About This Home
This home is located at 638 Carriage Ln N, Twin Falls, ID 83301 and is currently estimated at $629,615, approximately $229 per square foot. 638 Carriage Ln N is a home located in Twin Falls County with nearby schools including Pillar Falls Elementary School, Vera C. O'Leary Middle School, and Twin Falls Senior High School.
Ownership History
Date
Name
Owned For
Owner Type
Purchase Details
Closed on
Aug 15, 2007
Sold by
Simons Josh and Simons Beth
Bought by
Osterhout Michael R and Osterhout Jill C
Current Estimated Value
Home Financials for this Owner
Home Financials are based on the most recent Mortgage that was taken out on this home.
Original Mortgage
$140,000
Outstanding Balance
$88,460
Interest Rate
6.62%
Mortgage Type
New Conventional
Estimated Equity
$541,155
Purchase Details
Closed on
Apr 19, 2007
Sold by
Hainline Gary Gene
Bought by
Breck Benjamin W
Purchase Details
Closed on
Aug 21, 2006
Sold by
Branchflower Michael G
Bought by
Simons Josh and Simons Beth
Purchase Details
Closed on
Oct 19, 2005
Sold by
Simons Josh and Simons Beth
Bought by
Simons Josh and Simons Beth
Home Financials for this Owner
Home Financials are based on the most recent Mortgage that was taken out on this home.
Original Mortgage
$220,000
Interest Rate
5.67%
Mortgage Type
Future Advance Clause Open End Mortgage
Purchase Details
Closed on
May 24, 2005
Sold by
Morning Sun Pa Llc
Bought by
Simons Josh and Simons Beth
Home Financials for this Owner
Home Financials are based on the most recent Mortgage that was taken out on this home.
Original Mortgage
$42,120
Interest Rate
7.5%
Mortgage Type
Future Advance Clause Open End Mortgage
Create a Home Valuation Report for This Property
The Home Valuation Report is an in-depth analysis detailing your home's value as well as a comparison with similar homes in the area
Home Values in the Area
Average Home Value in this Area
Purchase History
| Date | Buyer | Sale Price | Title Company |
|---|---|---|---|
| Osterhout Michael R | -- | None Available | |
| Breck Benjamin W | -- | None Available | |
| Simons Josh | -- | Alliance Title | |
| Simons Josh | -- | -- | |
| Simons Josh | -- | -- |
Source: Public Records
Mortgage History
| Date | Status | Borrower | Loan Amount |
|---|---|---|---|
| Open | Osterhout Michael R | $140,000 | |
| Previous Owner | Simons Josh | $220,000 | |
| Previous Owner | Simons Josh | $42,120 |
Source: Public Records
Tax History Compared to Growth
Tax History
| Year | Tax Paid | Tax Assessment Tax Assessment Total Assessment is a certain percentage of the fair market value that is determined by local assessors to be the total taxable value of land and additions on the property. | Land | Improvement |
|---|---|---|---|---|
| 2024 | $4,436 | $594,681 | $111,815 | $482,866 |
| 2023 | $3,843 | $589,950 | $111,815 | $478,135 |
| 2022 | $5,798 | $631,372 | $92,841 | $538,531 |
| 2021 | $4,596 | $430,246 | $68,257 | $361,989 |
| 2020 | $4,222 | $376,748 | $78,964 | $297,784 |
| 2019 | $4,556 | $355,040 | $68,257 | $286,783 |
| 2018 | $4,419 | $335,960 | $42,323 | $293,637 |
| 2017 | $4,057 | $316,443 | $42,323 | $274,120 |
| 2016 | $3,575 | $273,114 | $0 | $0 |
| 2015 | $3,579 | $273,114 | $42,323 | $230,791 |
| 2012 | -- | $261,309 | $0 | $0 |
Source: Public Records
Map
Nearby Homes
- 568 Boxwood Dr
- 2858 Sunray Loop
- 2782 Sun Meadow Dr
- 2380 Twin Oaks Park
- 795 Sun Peak Way
- 2750 Joshua Way
- 362 Whispering Pine Dr
- 2937 Sundance Dr
- 2828 Sunray Loop
- 539 Rimview Dr
- 2757 Carriage Way
- 2351 Castle Dr
- 2431 Falls Ave E
- 2943 Sunlight Rd
- 2971 Sunlight Rd
- 2718 Whispering Pine Dr
- 975 Desert View Dr
- 2913 Evening Sun Dr
- 1014 Desert View Dr
- 265 Cedar Park Cir
- 656 Carriage Ln N
- 628 Carriage Ln N
- 608 Carriage Ln N
- 696 Whispering Pine Dr
- 695 Whispering Pine Dr
- 618 Carriage Ln N
- 674 Carriage Ln N
- 599 Boxwood Dr
- 590 Carriage Ln N
- 627 Morning Sun Dr
- 677 Whispering Pine Dr
- 645 Morning Sun Dr
- 678 Whispering Pine Dr
- 663 Morning Sun Dr
- 580 Carriage Ln N
- 692 Carriage Ln N
- 663 Whispering Pine Dr
- 664 Whispering Pine Dr
- 681 Morning Sun Dr
- 598 Boxwood Dr