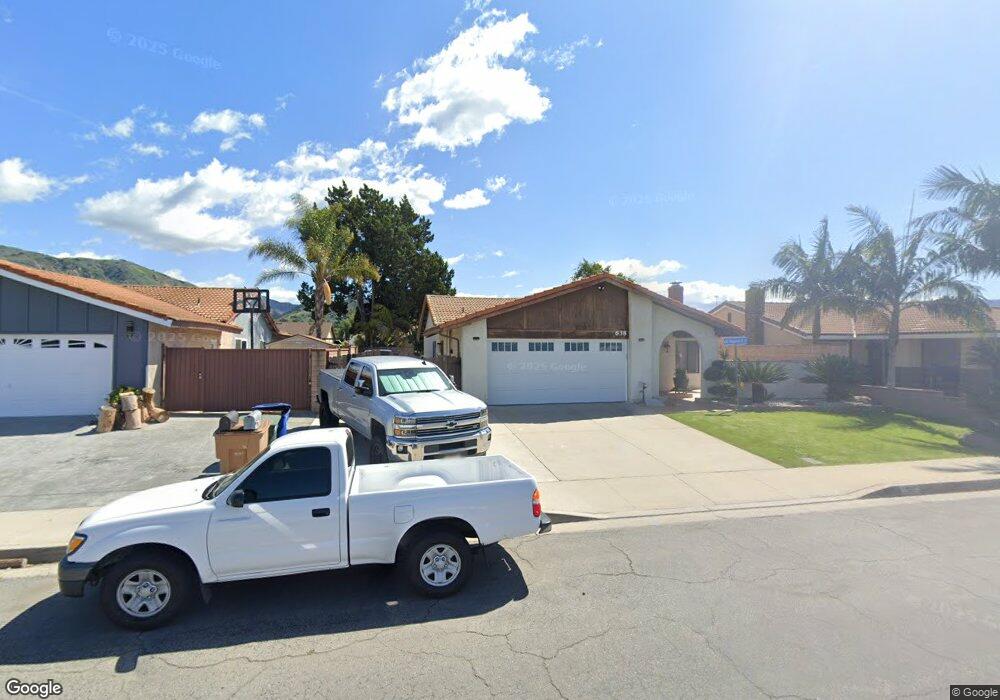
638 Chaparral St Fillmore, CA 93015
Estimated Value: $679,000 - $700,000
3
Beds
2
Baths
1,227
Sq Ft
$564/Sq Ft
Est. Value
About This Home
This home is located at 638 Chaparral St, Fillmore, CA 93015 and is currently estimated at $691,694, approximately $563 per square foot. 638 Chaparral St is a home located in Ventura County with nearby schools including Fillmore Senior High.
Ownership History
Date
Name
Owned For
Owner Type
Purchase Details
Closed on
Oct 25, 2013
Sold by
Brookfield Relocation Inc
Bought by
Julian Nicolas and Orozco Leticia
Current Estimated Value
Home Financials for this Owner
Home Financials are based on the most recent Mortgage that was taken out on this home.
Original Mortgage
$248,000
Interest Rate
4.04%
Mortgage Type
New Conventional
Purchase Details
Closed on
Oct 4, 2013
Sold by
Lori Robyn E and Lori Scott A
Bought by
Brookfield Relocation Inc
Home Financials for this Owner
Home Financials are based on the most recent Mortgage that was taken out on this home.
Original Mortgage
$248,000
Interest Rate
4.04%
Mortgage Type
New Conventional
Purchase Details
Closed on
Oct 19, 2009
Sold by
Allison Edward J and Allison Lynn
Bought by
Lori Robyn E and Lori Scott A
Home Financials for this Owner
Home Financials are based on the most recent Mortgage that was taken out on this home.
Original Mortgage
$318,450
Interest Rate
4.83%
Mortgage Type
FHA
Purchase Details
Closed on
Mar 26, 1997
Sold by
Allison Edward J
Bought by
Allison Edward J and Allison Lynn
Home Financials for this Owner
Home Financials are based on the most recent Mortgage that was taken out on this home.
Original Mortgage
$25,000
Interest Rate
7.66%
Create a Home Valuation Report for This Property
The Home Valuation Report is an in-depth analysis detailing your home's value as well as a comparison with similar homes in the area
Home Values in the Area
Average Home Value in this Area
Purchase History
| Date | Buyer | Sale Price | Title Company |
|---|---|---|---|
| Julian Nicolas | $310,000 | Stewart Title Of California | |
| Brookfield Relocation Inc | $310,000 | Stewart Title Guaranty Co | |
| Lori Robyn E | $330,000 | Multiple | |
| Allison Edward J | -- | Old Republic Title Company |
Source: Public Records
Mortgage History
| Date | Status | Borrower | Loan Amount |
|---|---|---|---|
| Previous Owner | Julian Nicolas | $248,000 | |
| Previous Owner | Lori Robyn E | $318,450 | |
| Previous Owner | Allison Edward J | $25,000 |
Source: Public Records
Tax History Compared to Growth
Tax History
| Year | Tax Paid | Tax Assessment Tax Assessment Total Assessment is a certain percentage of the fair market value that is determined by local assessors to be the total taxable value of land and additions on the property. | Land | Improvement |
|---|---|---|---|---|
| 2025 | $4,141 | $380,007 | $152,003 | $228,004 |
| 2024 | $4,141 | $372,556 | $149,022 | $223,534 |
| 2023 | $4,083 | $365,251 | $146,100 | $219,151 |
| 2022 | $3,773 | $358,090 | $143,236 | $214,854 |
| 2021 | $4,291 | $351,069 | $140,427 | $210,642 |
| 2020 | $3,979 | $347,471 | $138,988 | $208,483 |
| 2019 | $3,989 | $340,659 | $136,263 | $204,396 |
| 2018 | $3,908 | $333,981 | $133,592 | $200,389 |
| 2017 | $3,929 | $327,433 | $130,973 | $196,460 |
| 2016 | $3,636 | $321,013 | $128,405 | $192,608 |
| 2015 | $3,534 | $316,193 | $126,477 | $189,716 |
| 2014 | $3,530 | $310,000 | $124,000 | $186,000 |
Source: Public Records
Map
Nearby Homes
- 638 Chapparel St
- 646 Chapparel St
- 634 Chapparel St
- 646 Chaparral St
- 639 Manzanita Dr
- 652 Chapparel St
- 647 Manzanita Dr
- 635 Manzanita Dr
- 628 Chapparel St
- 643 Chapparel St
- 639 Chapparel St
- 653 Manzanita Dr
- 629 Manzanita Dr
- 651 Chapparel St
- 660 Chapparel St
- 631 Chapparel St
- 826 3rd St
- 659 Manzanita Dr
- 627 Chapparel St
- 834 3rd St